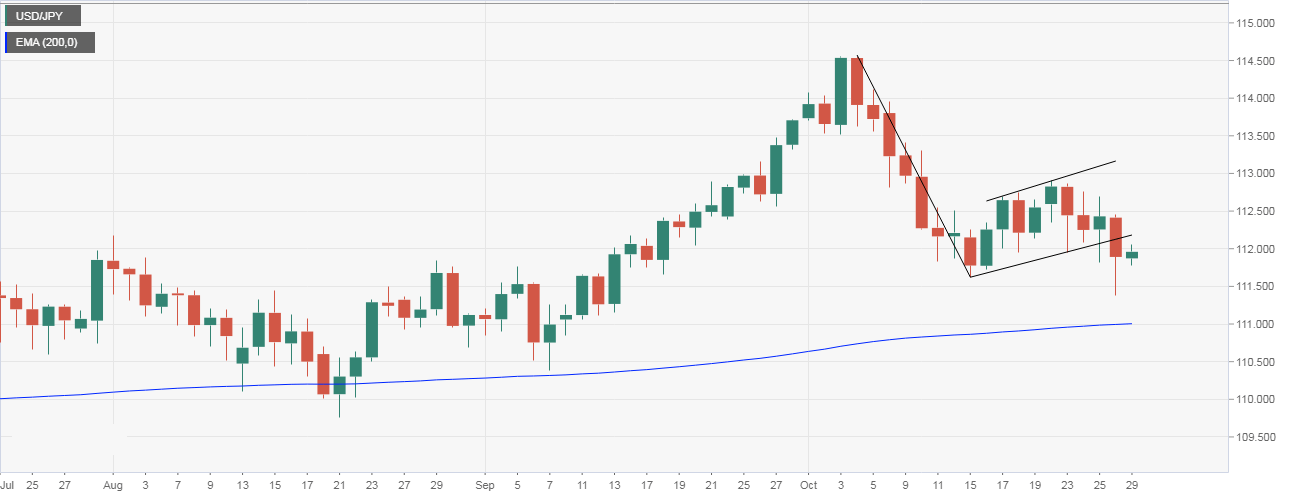
- The USD/JPY pair closed well below 112.10, confirming a bear flag breakdown – a bearish continuation pattern – which indicates a resumption of the sell-off from the recent high of 114.55.
- The bearish pattern has opened the doors to a sell-off to levels below 110.00. On the way lower, the pair may encounter support at 110.97 (200-day exponential moving average).
- A close above Friday’s high of 112.44 would invalidate the bearish setup.
Daily chart
Spot Rate: 111.97
Daily High: 112.05
Daily Low: 111.77
Trend: Bearish
Resistance
R1: 112.19 (lower edge of the flag)
R2: 112.44 (Friday’s high)
R3: 112.89 (Oct. 22 high)
Support
S1: 111.62 (Oct. 15 low)
S2: 111.38 (Friday’s low)
S3: 110.97 (200-day EMA)
