“¢ The pair started retreating from 50% Fibonacci retracement level of overnight downfall, also coinciding with 100-hour EMA, after worse than expected US data.
“¢ Against the backdrop of a weaker USD, a fall below late Asian/European session consolidation phase now seems to have opened room for a follow-through downslide.
“¢ A sustained move beyond the 110.90-111.00 region would be needed to negate the short-term bearish outlook and increase prospects for any further recovery.
USD/JPY 1-hourly chart
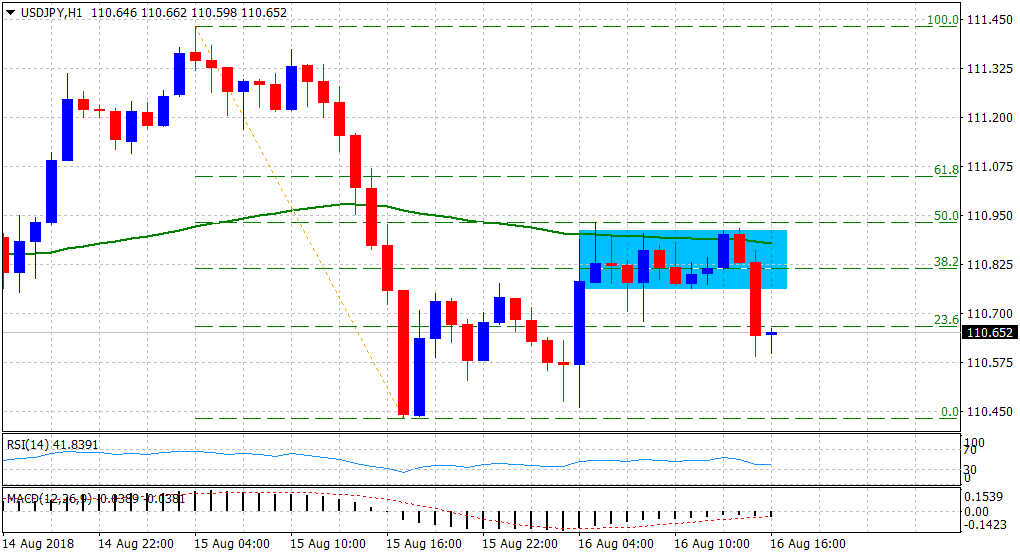
Spot Rate: 110.65
Daily High: 110.93
Daily Low: 110.46
Trend: Bearish
Resistance
R1: 110.93 (current day swing high)
R2: 111.14 (100-period SMA H4)
R3: 111.33 (R1 daily pivot-point)
Support
S1: 110.45 (horizontal zone)
S2: 110.11 (weekly low set on Monday)
S3: 109.86 (S2 daily pivot-point)
