- USD/JPY is losing about 90 pips on Friday amid broad-based USD selling.
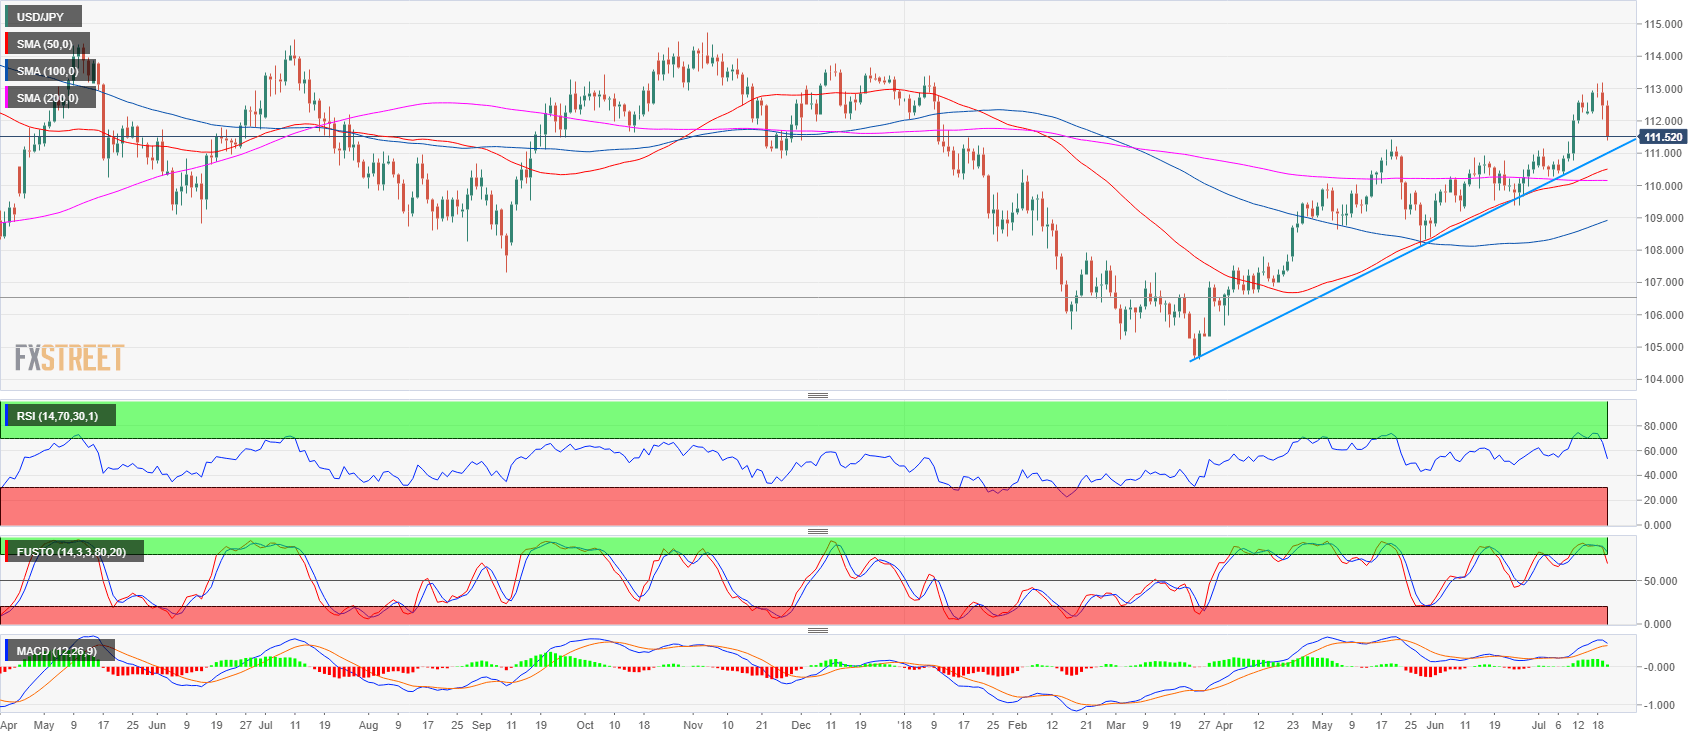
- USD/JPY is still holding above a daily trendline from March, 26 suggesting that the bull trend is still in effect. However, the sell-off is happening near the 2018 high and just below the weekly 200-period simple moving average, increasing the odds of a successful bearish reversal.
- USD/JPY just found support at 111.39 May 21 swing high and while a bounce can be expected it remains to be seen if the bull trend can actually resume to new highs.
USD/JPY 15-minute chart
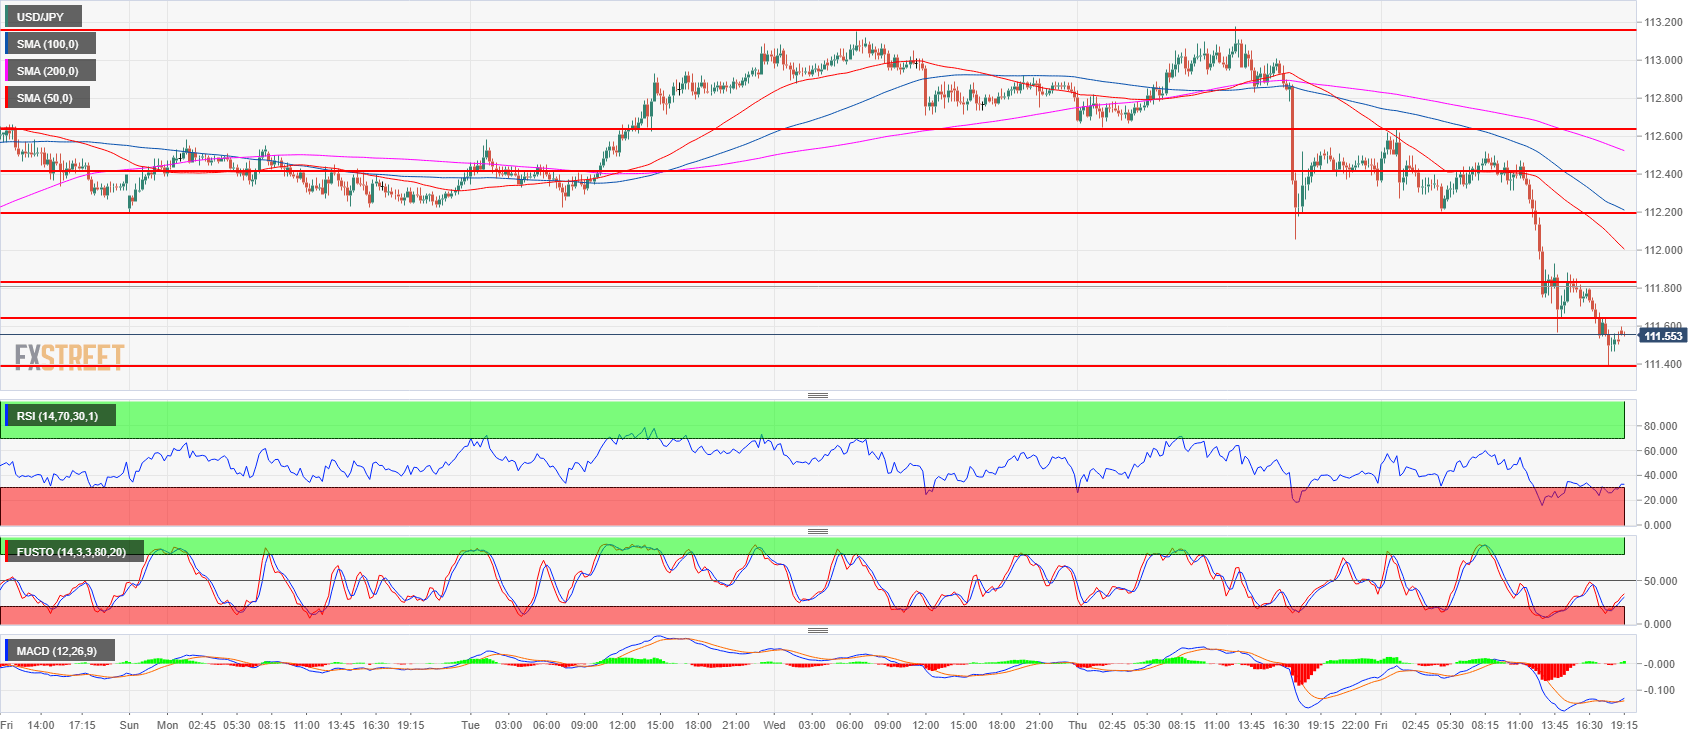
Spot rate: 111.56
Relative change: -0.81%
High: 112.64
Low: 111.39
Trend: Bullish / Risk of bearish reversal
Resistance 1: 111.60-111.80 area, 23.6% and 38.2% Fibonacci retracement low/high July 11
Resistance 2: 112.19-112.40 area, July 11 high and intraday swing low
Resistance 3: 112.64 July 12 high
Resistance 4: 113.18, 2018 high
Resistance 5: 113.26-113.38, 200-weekly simple moving average and January 8 high
Resistance 6: 114.45 October 27, 2017 high
Support 1: 111.39 May 21 swing high
Support 2: 111.02-111.16 previous intraday swing lows
Support 3: 110.90 June 15 swing high
USD/JPY Daily chart