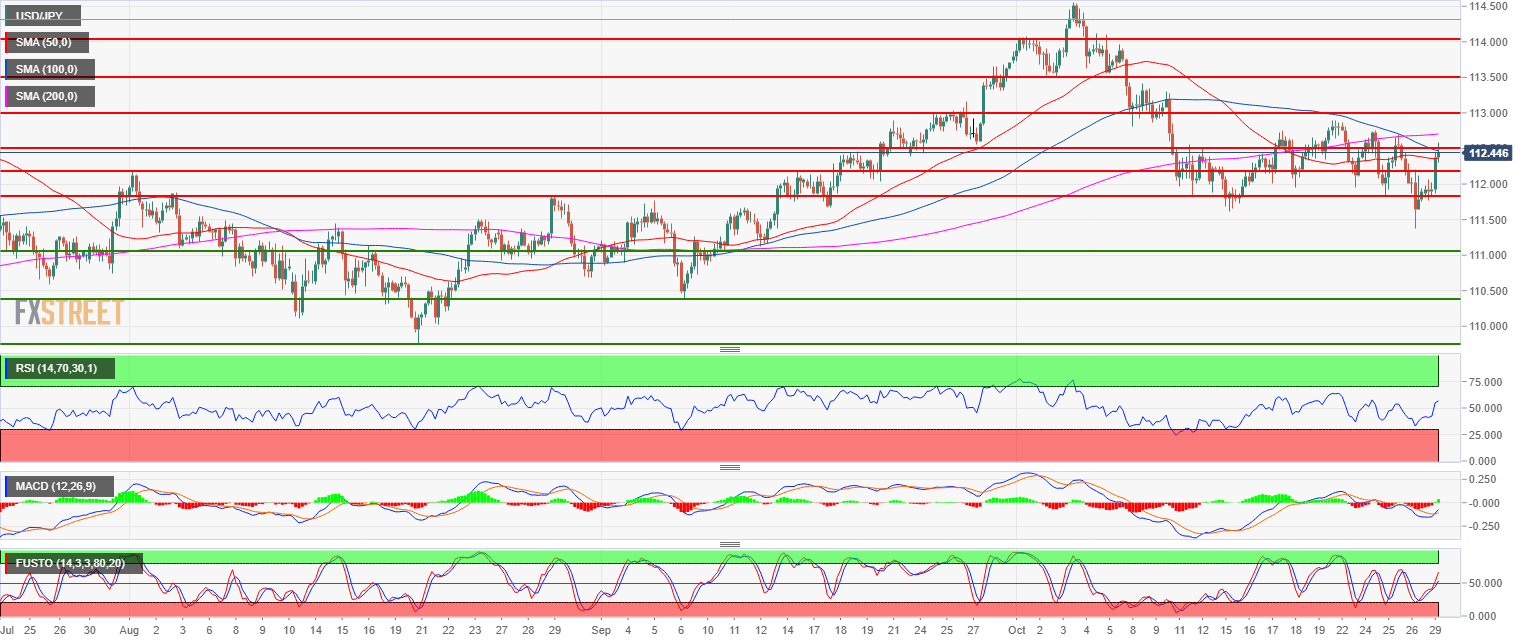
- USD/JPY is trapped in the 112.00-113.00 range while trading below a rather flat 200-period simple moving average on the 4-hour chart.
- USD/JPY bulls came back this Monday pushing the currency pair right into the 112.50 resistance and the 100-period simple moving average. Ideally, bulls would need a daily close above 112.50 and 113.00 to break away from the current range.
- In the absence a bullish breakout, failures to break above 112.50 and 113.00 would likely lead to a continuation of the current 112.00-113.00 range.
USD/JPY 4-hour chart
USD/JPY
Overview:
Last Price: 112.49
Daily change: 60 pips
Daily change: 0.536%
Daily Open: 111.89
Trends:
Daily SMA20: 112.79
Daily SMA50: 112.13
Daily SMA100: 111.58
Daily SMA200: 109.87
Levels:
Daily High: 112.46
Daily Low: 111.38
Weekly High: 112.9
Weekly Low: 111.38
Monthly High: 113.71
Monthly Low: 110.38
Daily Fibonacci 38.2%: 111.79
Daily Fibonacci 61.8%: 112.05
Daily Pivot Point S1: 111.36
Daily Pivot Point S2: 110.82
Daily Pivot Point S3: 110.27
Daily Pivot Point R1: 112.44
Daily Pivot Point R2: 112.99
Daily Pivot Point R3: 113.53
