- USD/JPY seesaws around four day low.
- 107.56/50, two-month-old rising trend line limits near-term declines.
Although 200-day SMA becomes the key upside for USD/JPY, the quote refrains from further declines while taking rounds to 108.50 during early Monday.
200-day Simple Moving Average (SMA) level of 109.10 and 61.8% Fibonacci retracement of April-August downpour at 109.40 act as important resistances that hold the gate for pair’s rise to 110.00.
Pair’s downside has strong support of 100-day SMA and 38.2% Fibonacci retracement confluence around 107.56/50, a break of which could drag the quote two-month-old rising support line, at 107.30.
Technical indicators, namely 14-bar Relative Strength Index (RSI) and 12-bar Moving Average Convergence and Divergence (MACD) are mostly in favor of the pair’s further advances. Though, a lower high formation and important SMA question buyers.
USD/JPY daily chart
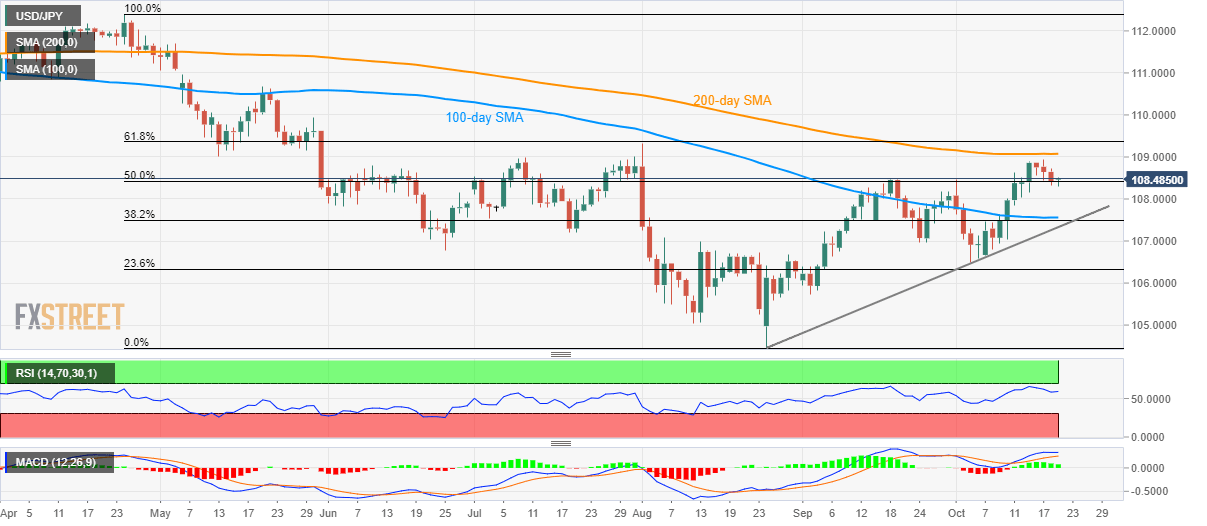
Trend: sideways
