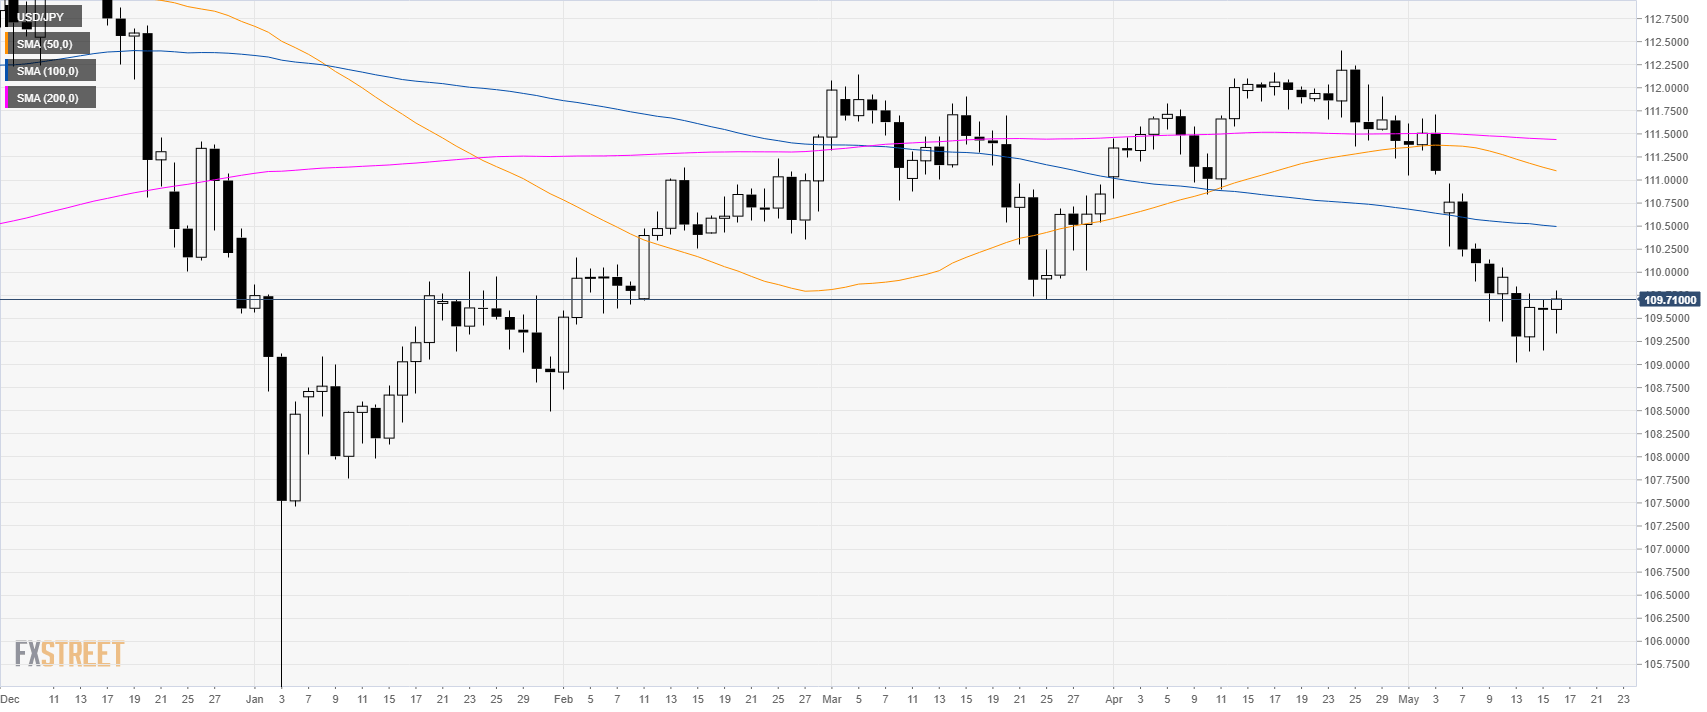
USD/JPY daily chart
USD/JPY has been trading in a bear leg below its main simple moving averages (SMAs).
USD/JPY is trying to establish a base above the 109.00 figure.
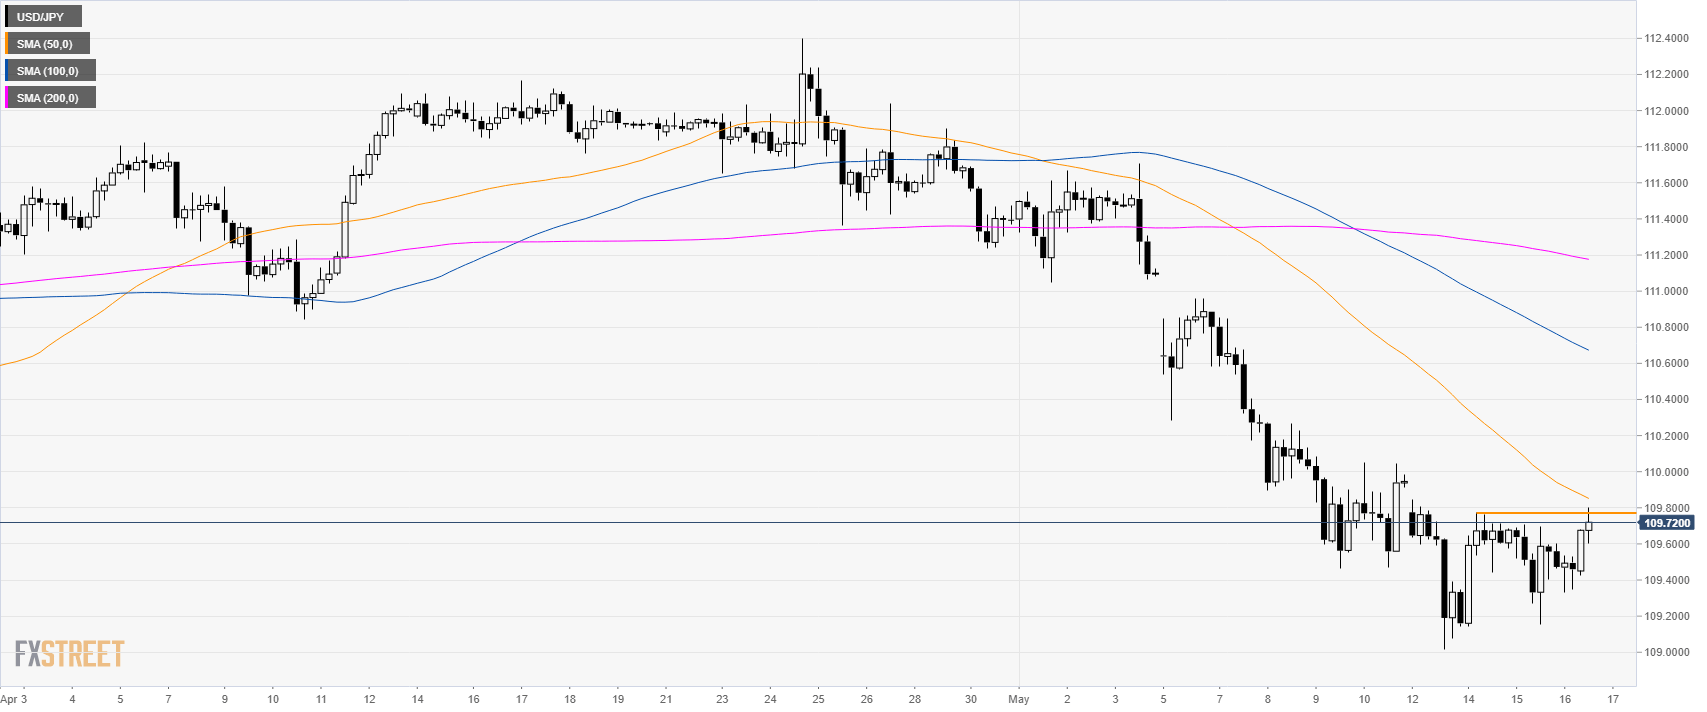
USD/JPY 4-hour chart
USD/JPY is challenging 109.77 swing high.
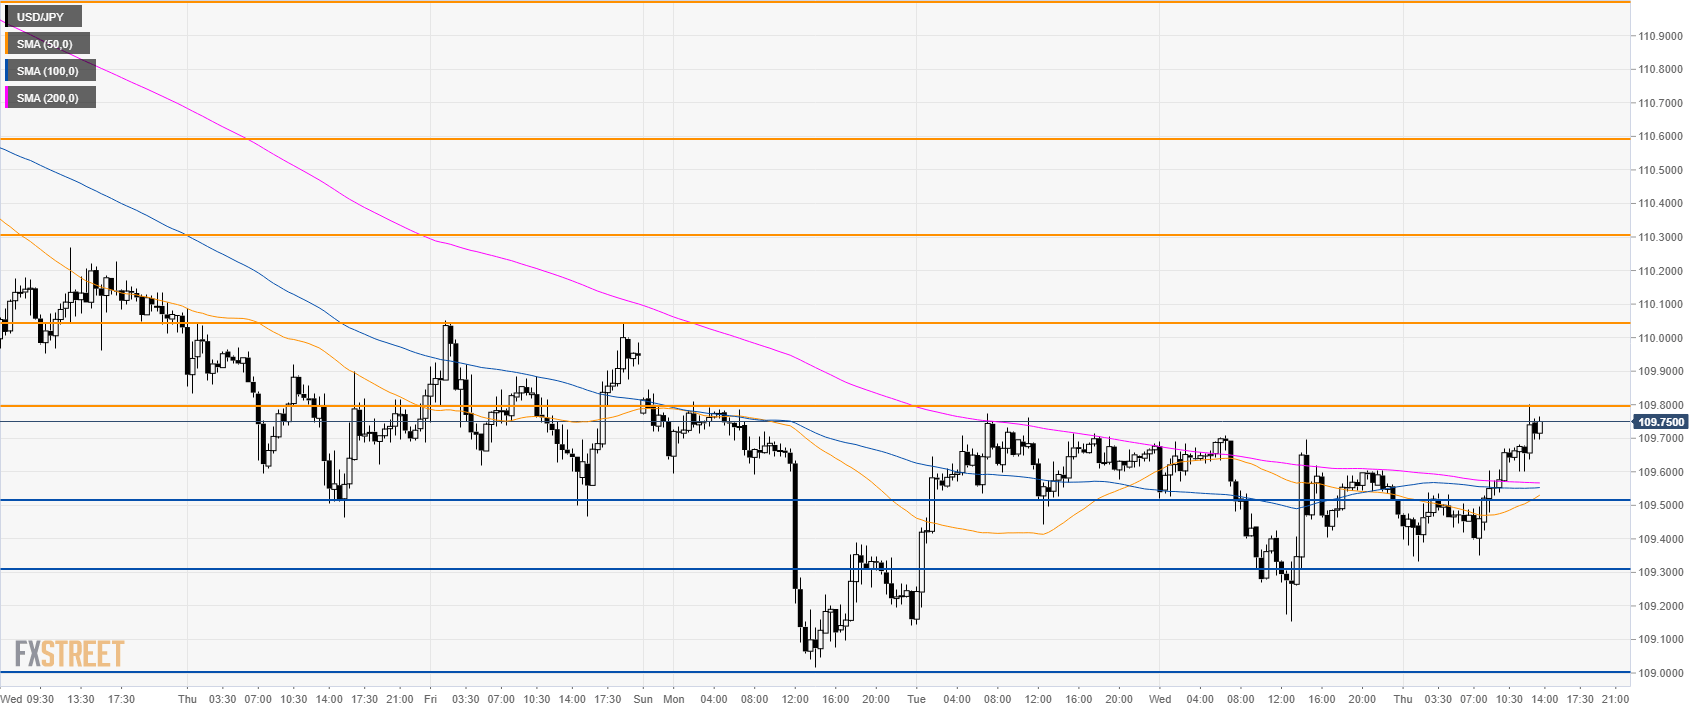
USD/JPY 30-minute chart
USD/JPY is trading above its main SMAs suggesting a bullish bias in the near term.
Buyers need to break above 109.80 and the 110.06 resistance to move up towards the 110.30 and 110.60 price levels.
Support is at 109.50/30 and the 109.00 support. A break below 109.00 on a daily closing basis might invalidate the bullish scenario.
Additional key levels
