“¢ Overnight recovery attempt was sold into near the key 110.00 psychological mark, coinciding with a short-term symmetrical triangular formation on the 4-hourly chart.
“¢ The fact that the pair remains below 50, 100 & 200-period SMA on the said chart reinforces overnight bearish breakdown and prospects for an additional near-term downside.
“¢ Short-term technical indicators have struggled to move back into positive territory and add credence to the negative outlook.
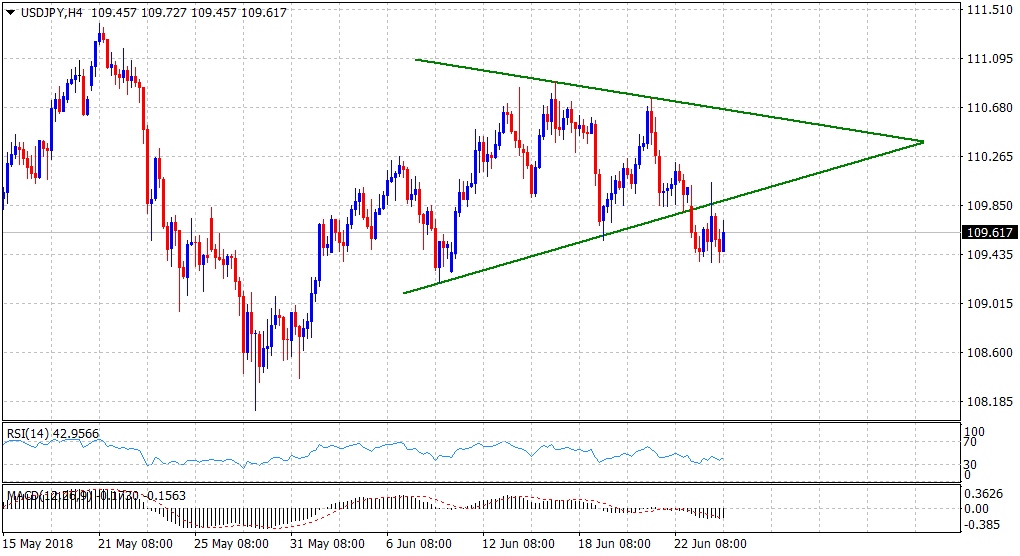
Spot Rate: 109.62
Daily High: 109.78
Daily Low: 109.39
Trend: Bearish
Resistance
R1: 109.89 (triangle support break-point turned resistance)
R2: 110.00 (psychological round figure mark)
R3: 110.21 (the very important 200-day SMA)
Support
S1: 109.37 (current/previous day swing low)
S2: 109.05 (S2 daily pivot-point)
S3: 108.72 (monthly low set on June 1)
