- The safe-haven Yen is on the rise (USD/JPY down) on the back of trade tensions between the US and China.
- It has been reported that several major technology companies will stop supplying Huawei (giant Chinese company) with the parts to build smartphones and other electronic devices. This is a step further in the trade war.
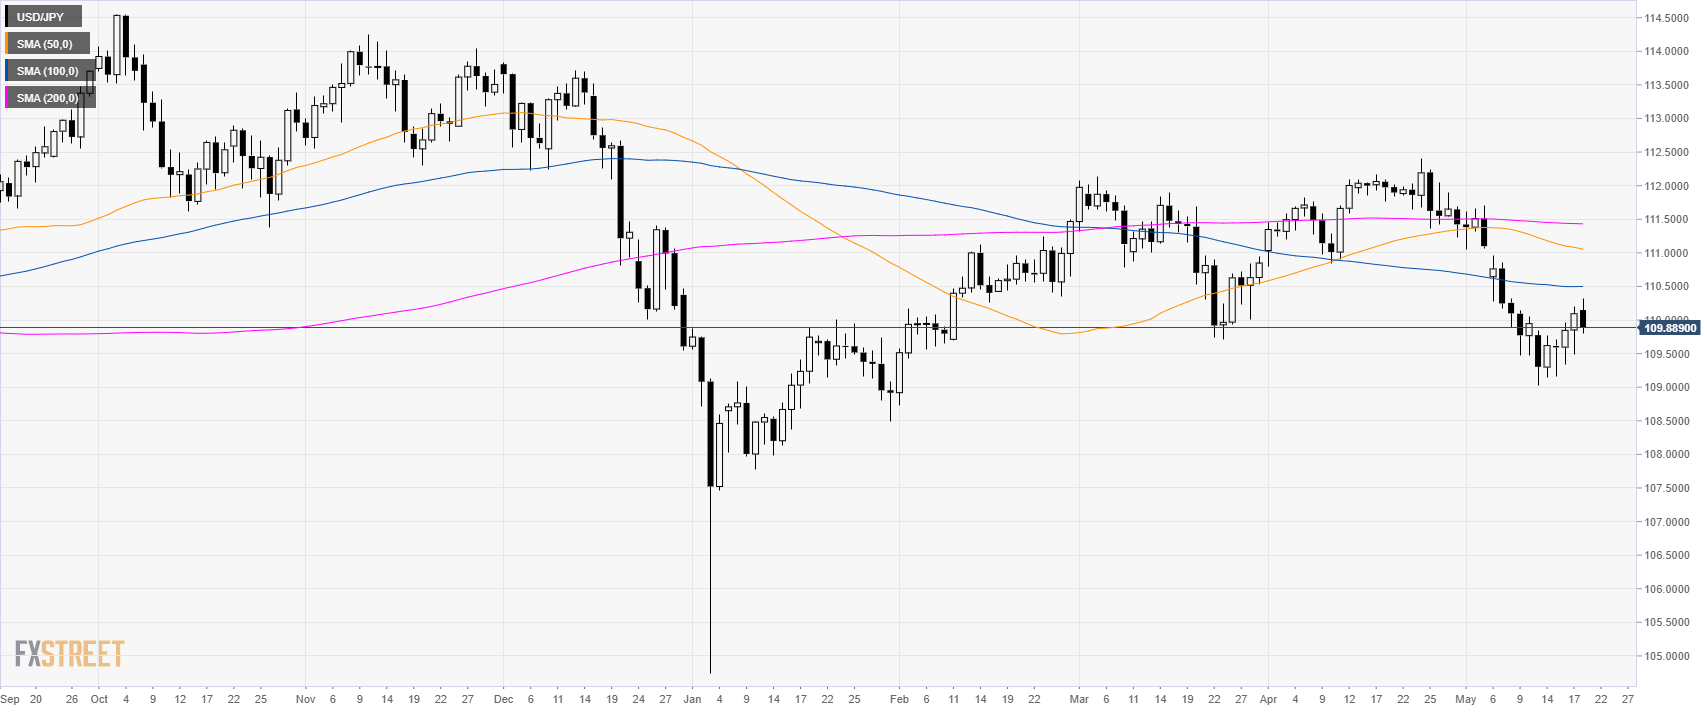
USD/JPY daily chart
The USD/JPY currency pair is trying to form a base above the 109.00 figure.
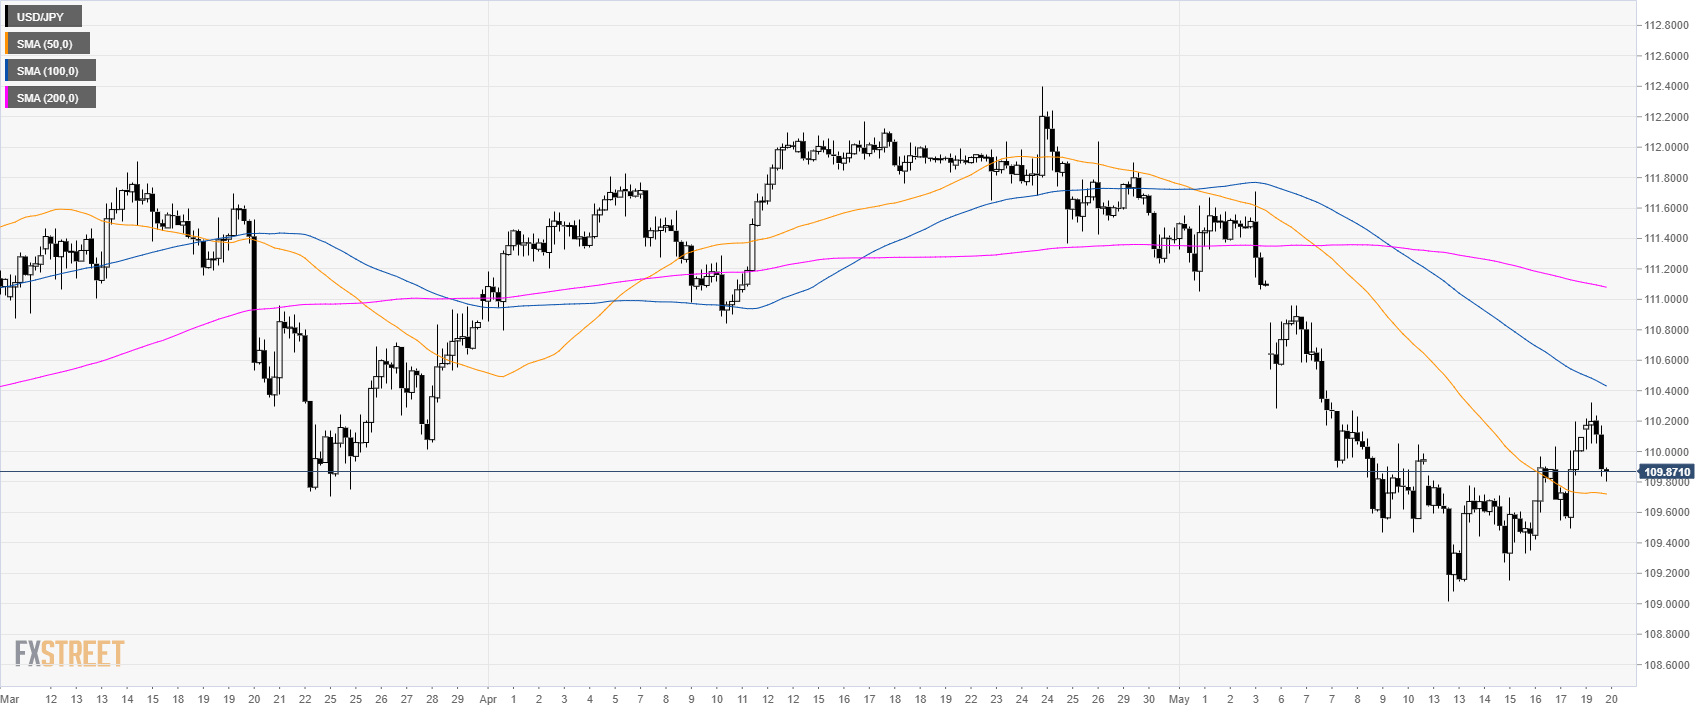
USD/JPY 4-hour chart
USD/JPY is making higher highs and lower lows on the 4-hour chart suggesting that the bulls have regained some control.
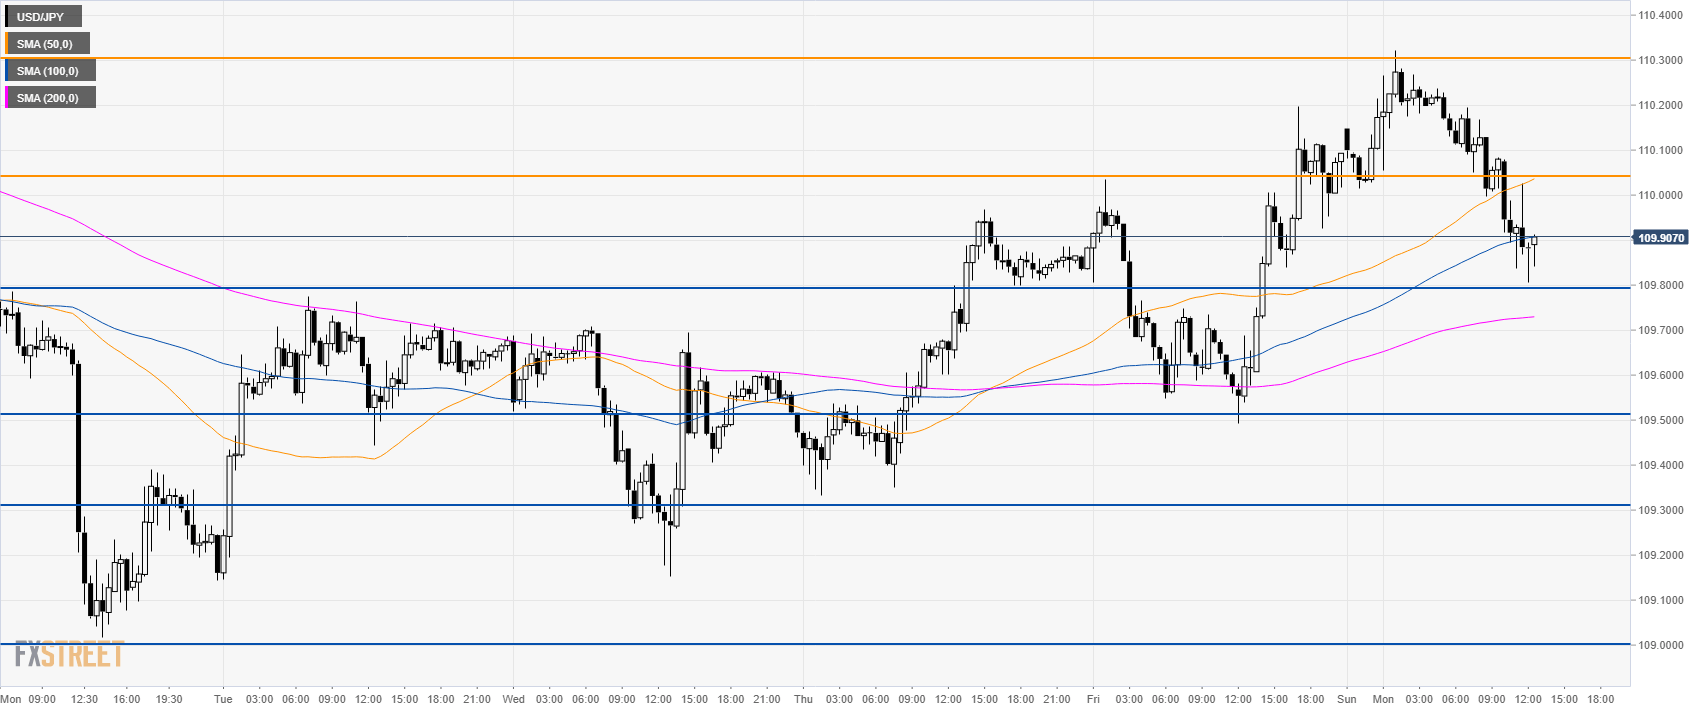
USD/JPY 30-minute chart
USD/JPY is trading below its 50 and 100 SMA suggesting that the market is currently in a correction. If bulls can find some footing near 109.80 support they can aim toward 110.05 and 110.30 resistances. Further down, support is at 109.50 and 109.30. A break below 109.00 on a daily closing basis can invalidate the bullish bias.
Additional key levels
