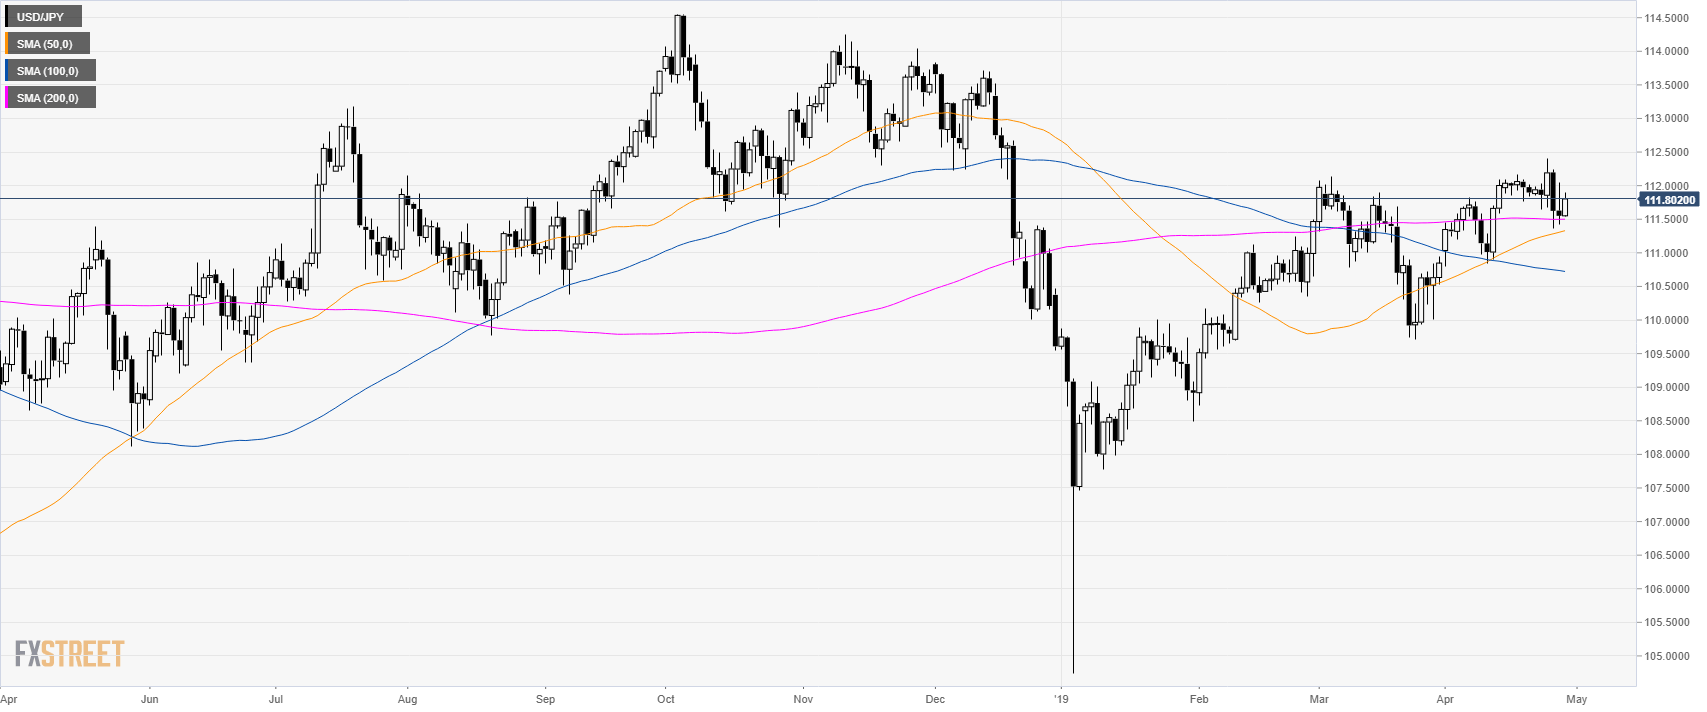
Home USD/JPY Technical Analysis: Greenback bulls looking at the 112.05 resistance
FXStreet News

USD/JPY Technical Analysis: Greenback bulls looking at the 112.05 resistance

USD/JPY daily chart

  • USD/JPY is trading in a bull trend above its main SMAs.


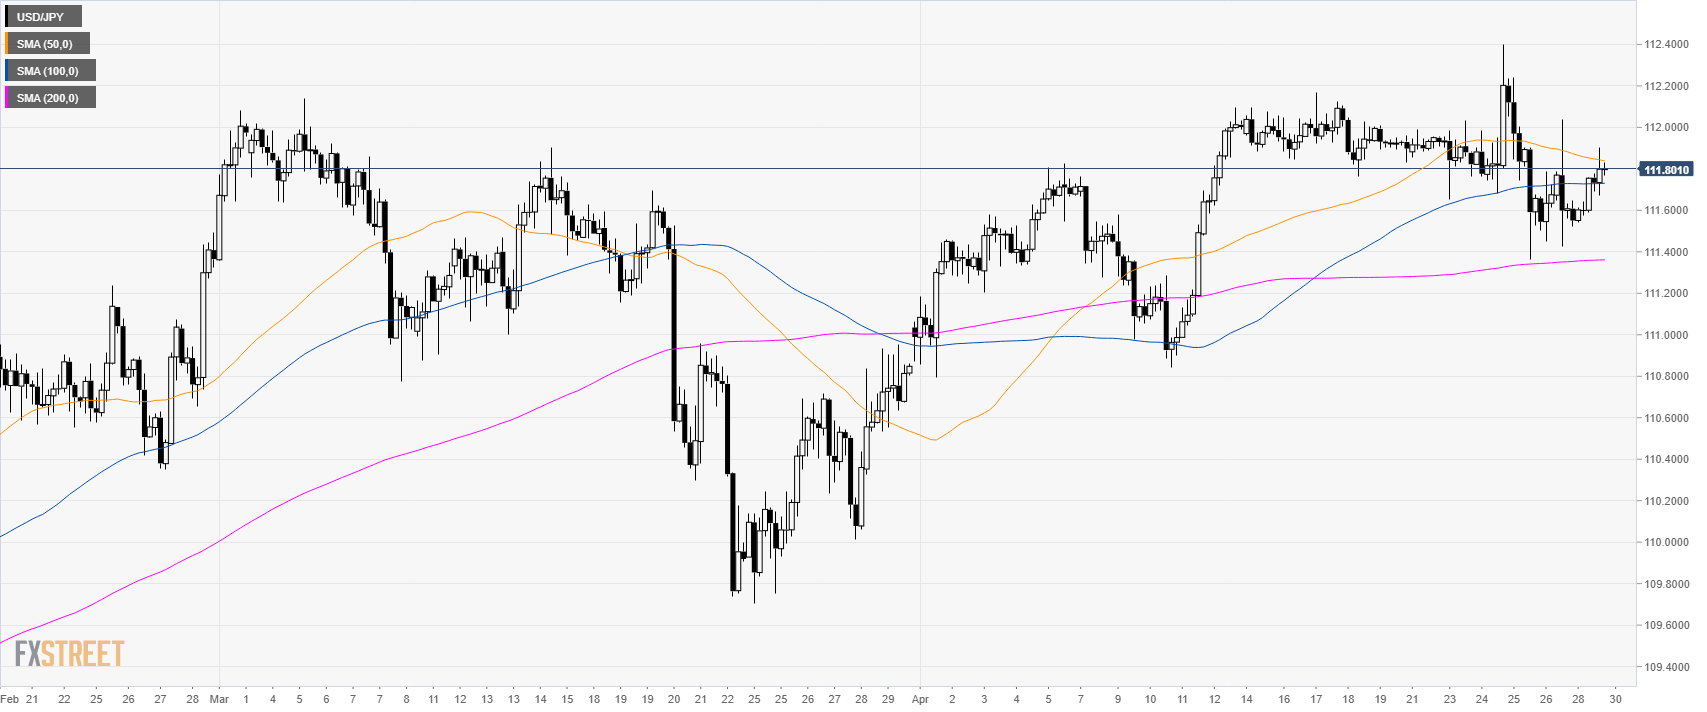
USD/JPY 4-hour chart

  • USD/JPY is consolidating the recent gains above the 100 and 200 SMAs.


USD/JPY 30-minute chart

  • USD/JPY is trading above its main SMAs suggesting bullish momentum in the short-term.
  • Bulls will need to break 111.90 to the upside to reach 112.05, 112.20 and 112.35 level.  

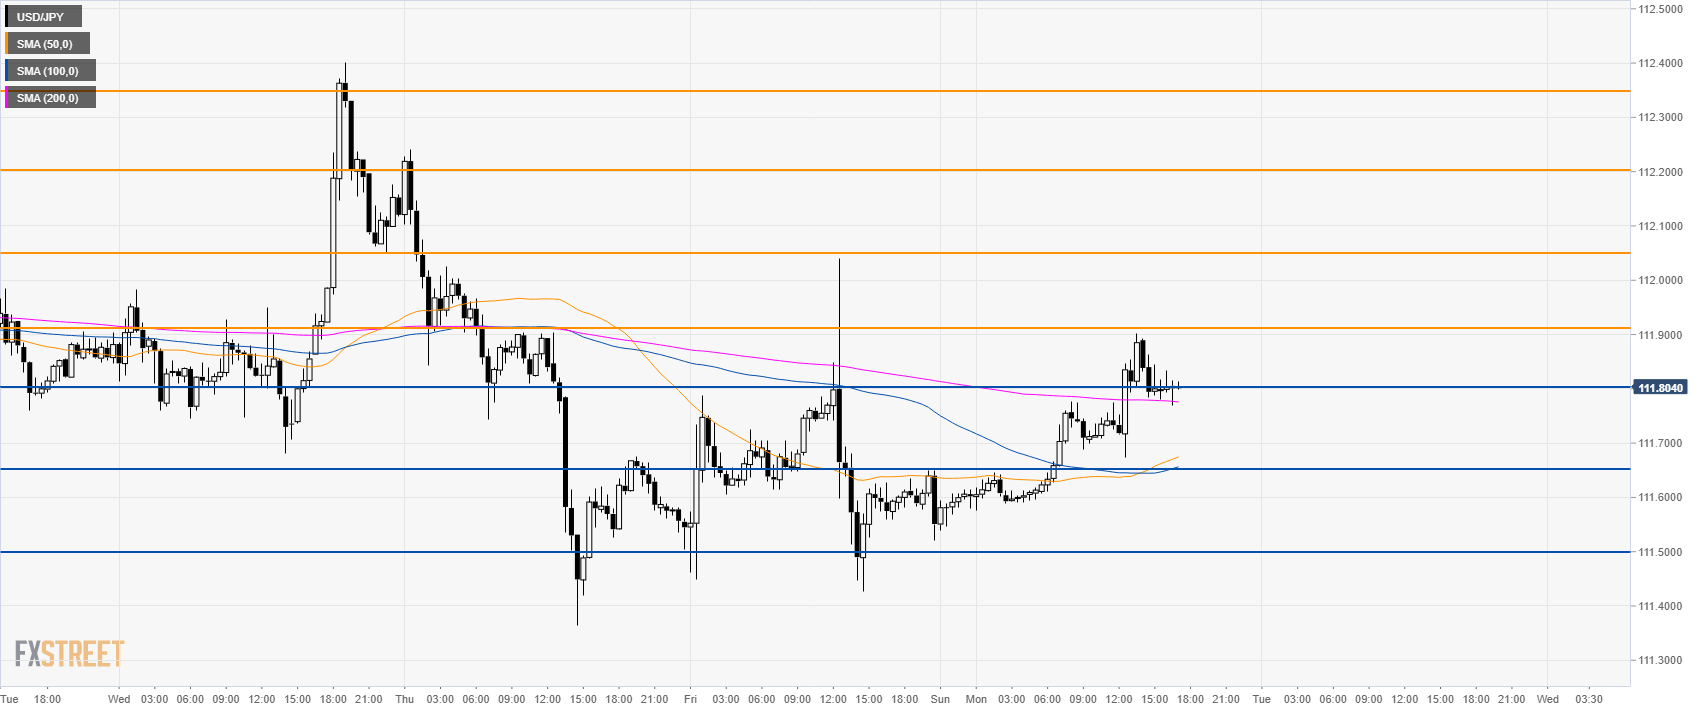
Additional key levels


FX Street

FX Street

FXStreet is the leading independent portal dedicated to the Foreign Exchange (Forex) market. It was launched in 2000 and the portal has always been proud of their unyielding commitment to provide objective and unbiased information, to enable their users to take better and more confident decisions.