- USD/JPY is holding near daily highs as the London session is about to come to an end.
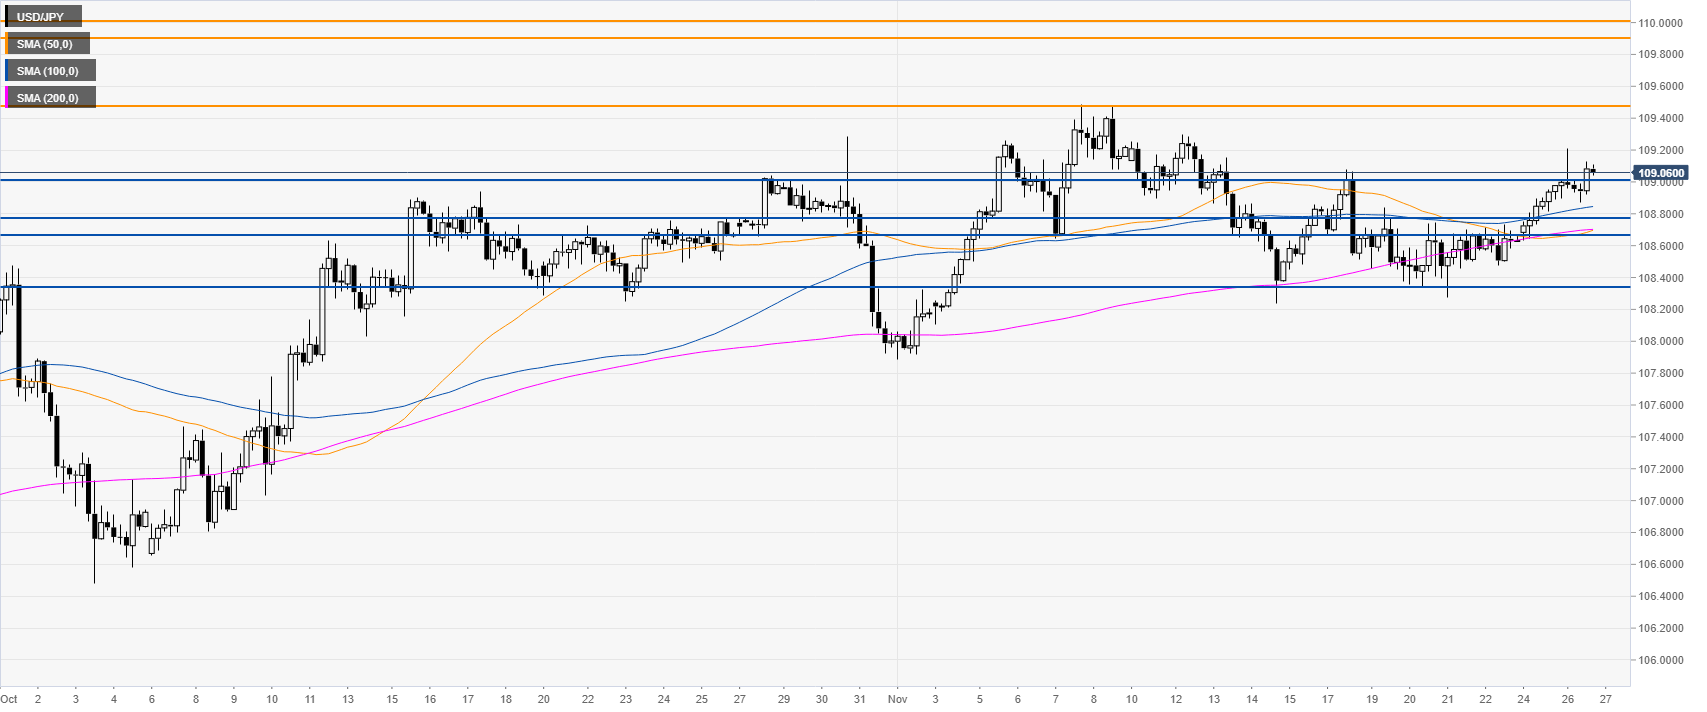
- Resistance on the way up is seen at 109.46 and 109.92/110.00 price zone.
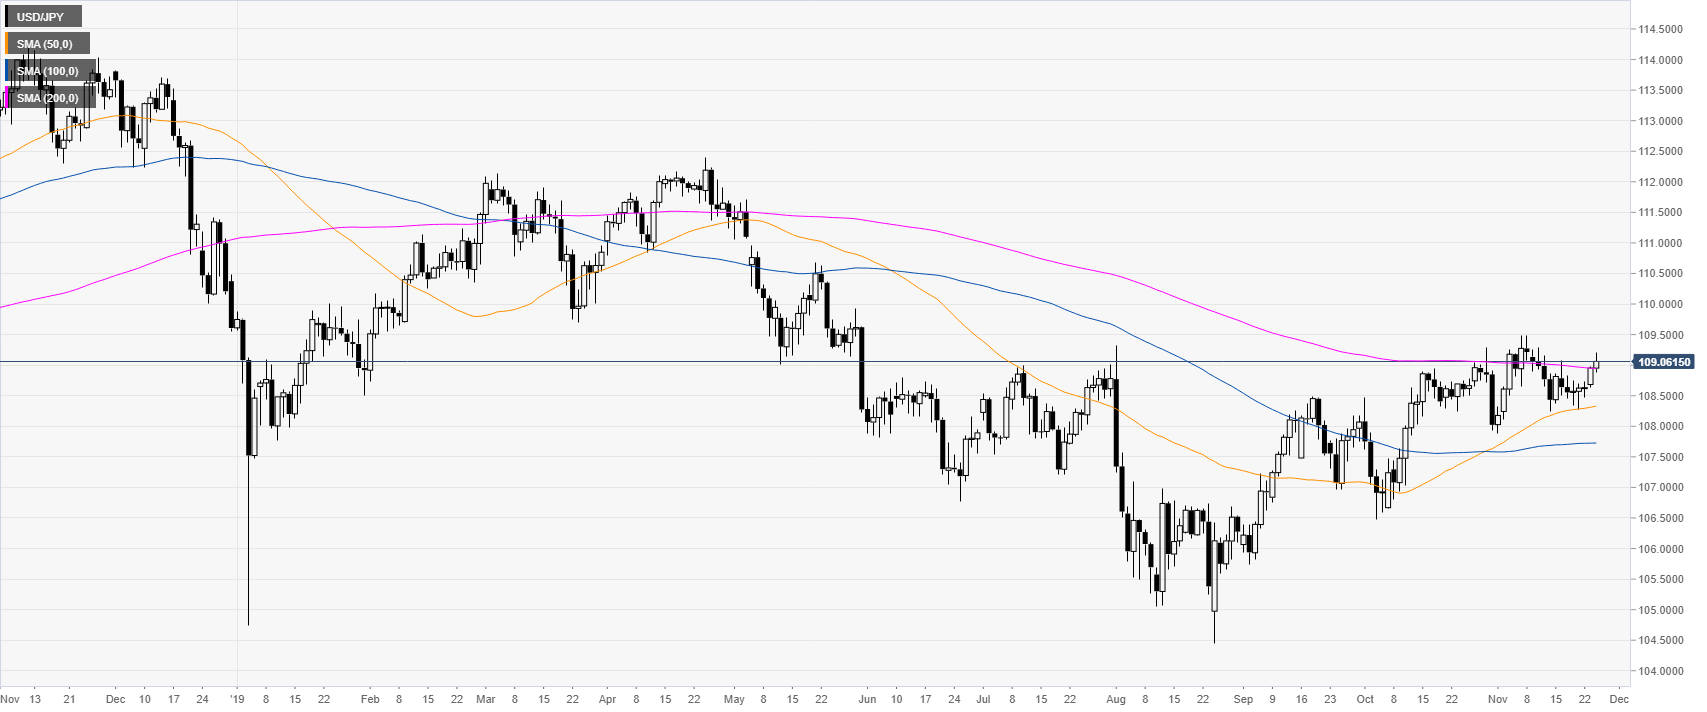
USD/JPY daily chart
USD/JPY is trading just above the 109.00 handle and the 200-day simple moving average (DMA) on the daily time frame. In the last three months, the spot has been gaining momentum.
USD/JPY four-hour chart
USD/JPY is holding above the 109.01 support level while trading above the main SMAs. As the market is gaining strength, the spot could be traveling towards the 109.46 level and the 109.92/110.00 resistance zone, according to the Technical Confluences Indicator.
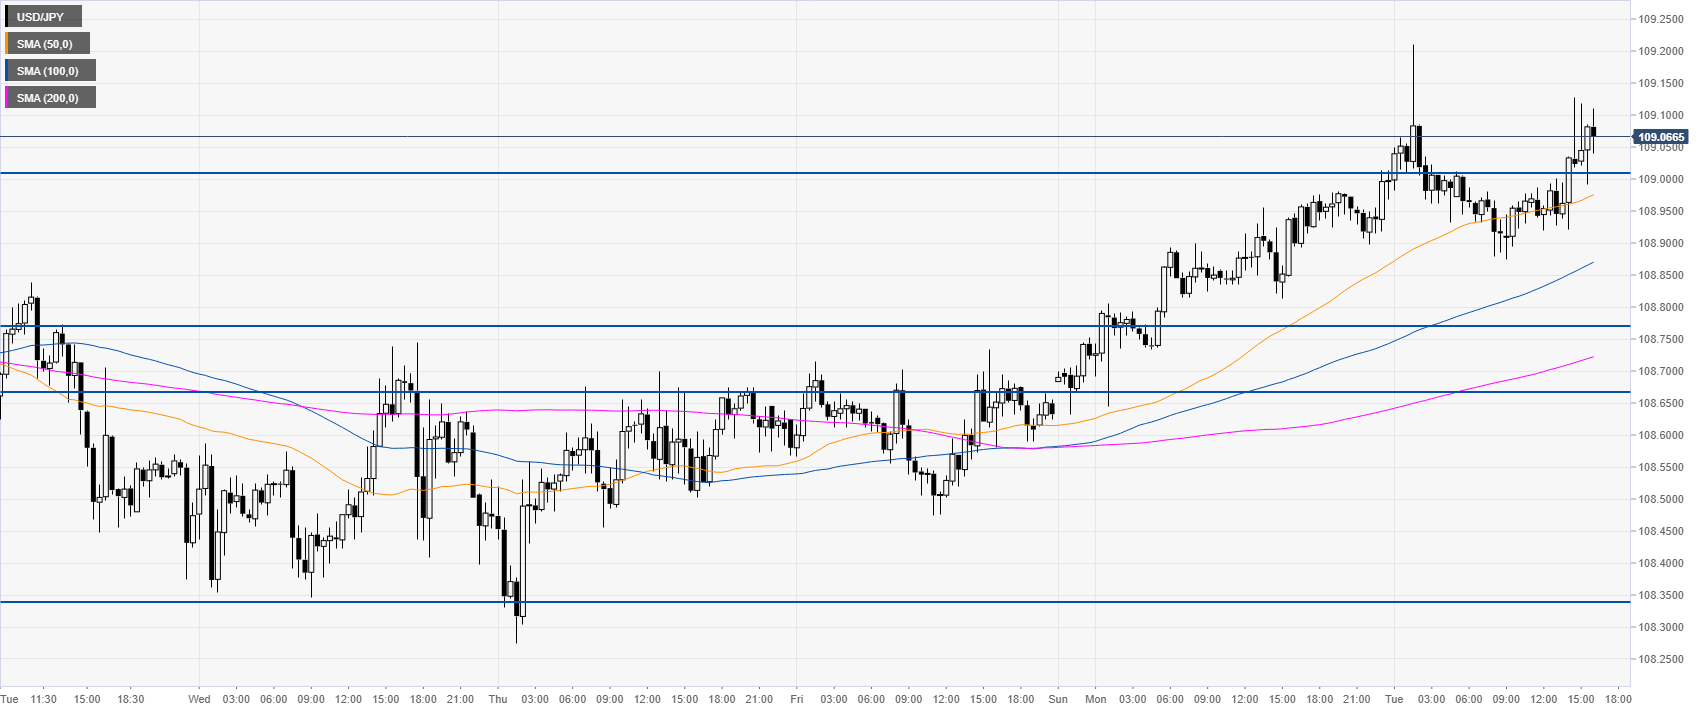
USD/JPY 30-minute chart
USD/JPY is trading above the main SMAs on the 30-minute chart. Support is seen at 109.01, the 108.66/78 zone and 108.33 level, according to the Technical Confluences Indicator.
Additional key levels


