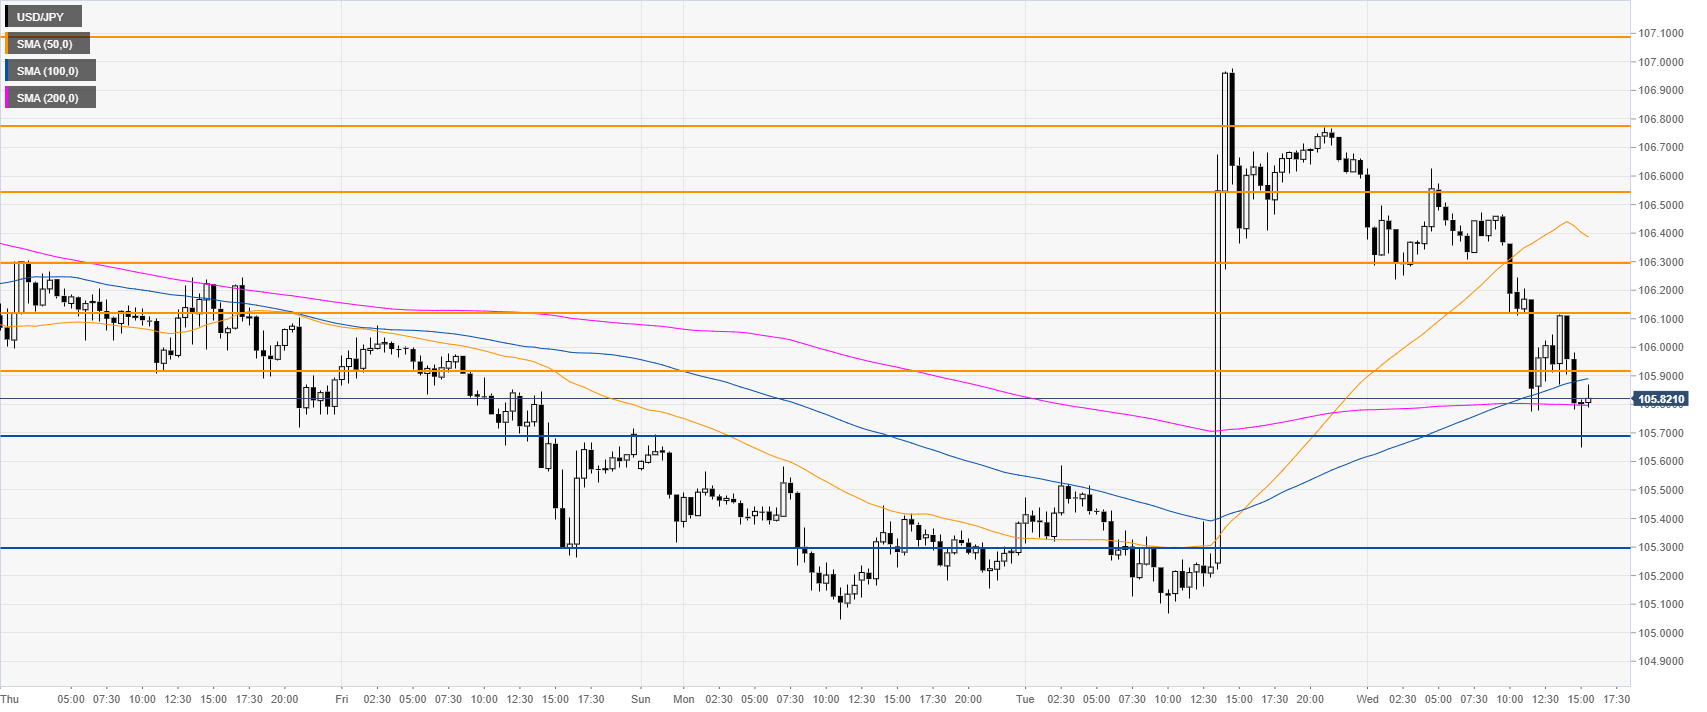
- USD/JPY is erasing most of the gains established on Tuesday.
- The levels to beat for bulls are at the 105.90 and 106.12 resistances.
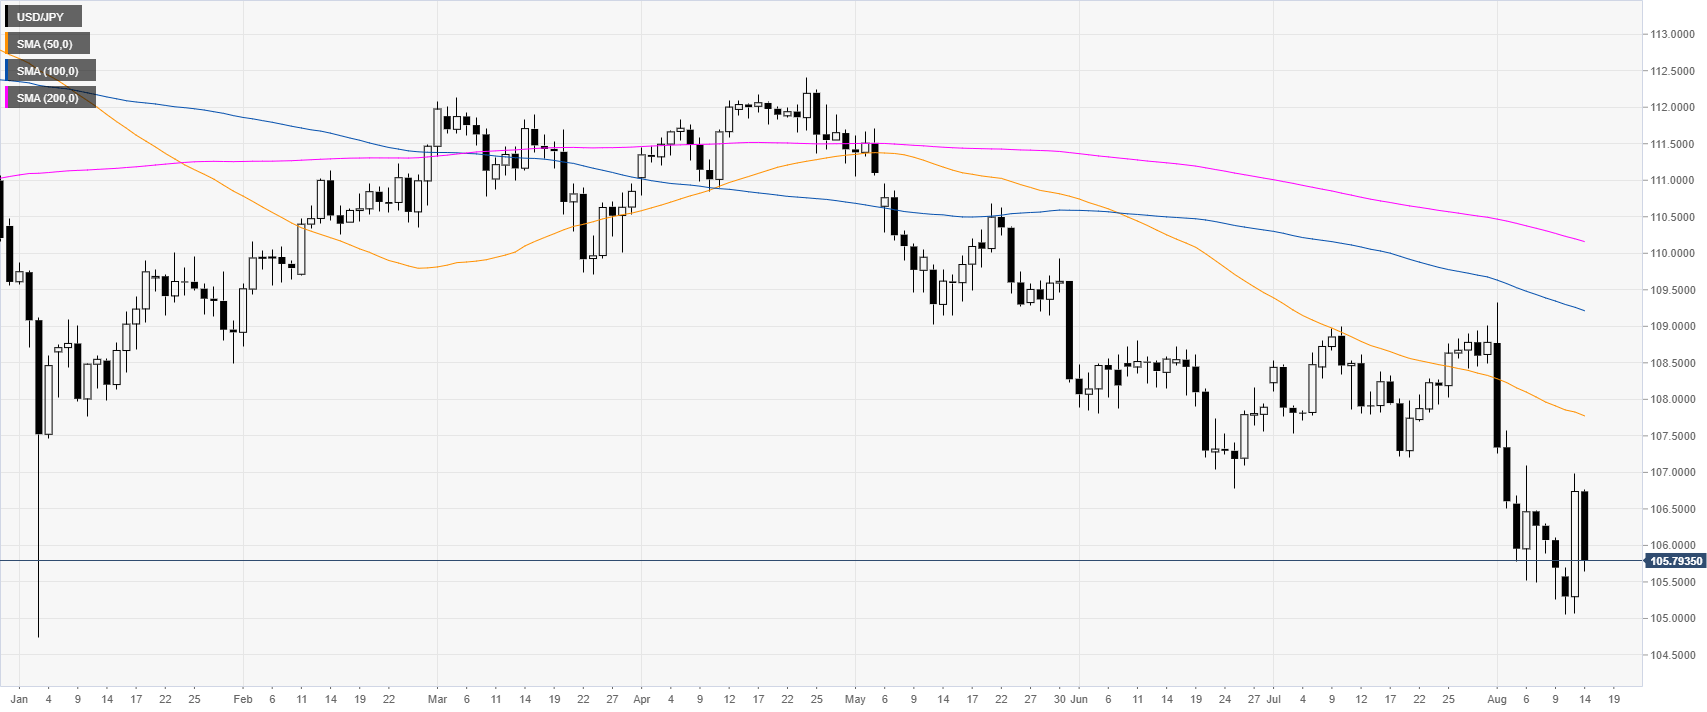
USD/JPY daily chart
USD/JPY is trading near multi-month lows while below the main daily simple moving averages (DSMAs). Trade war news are driving USD/JPY price action.
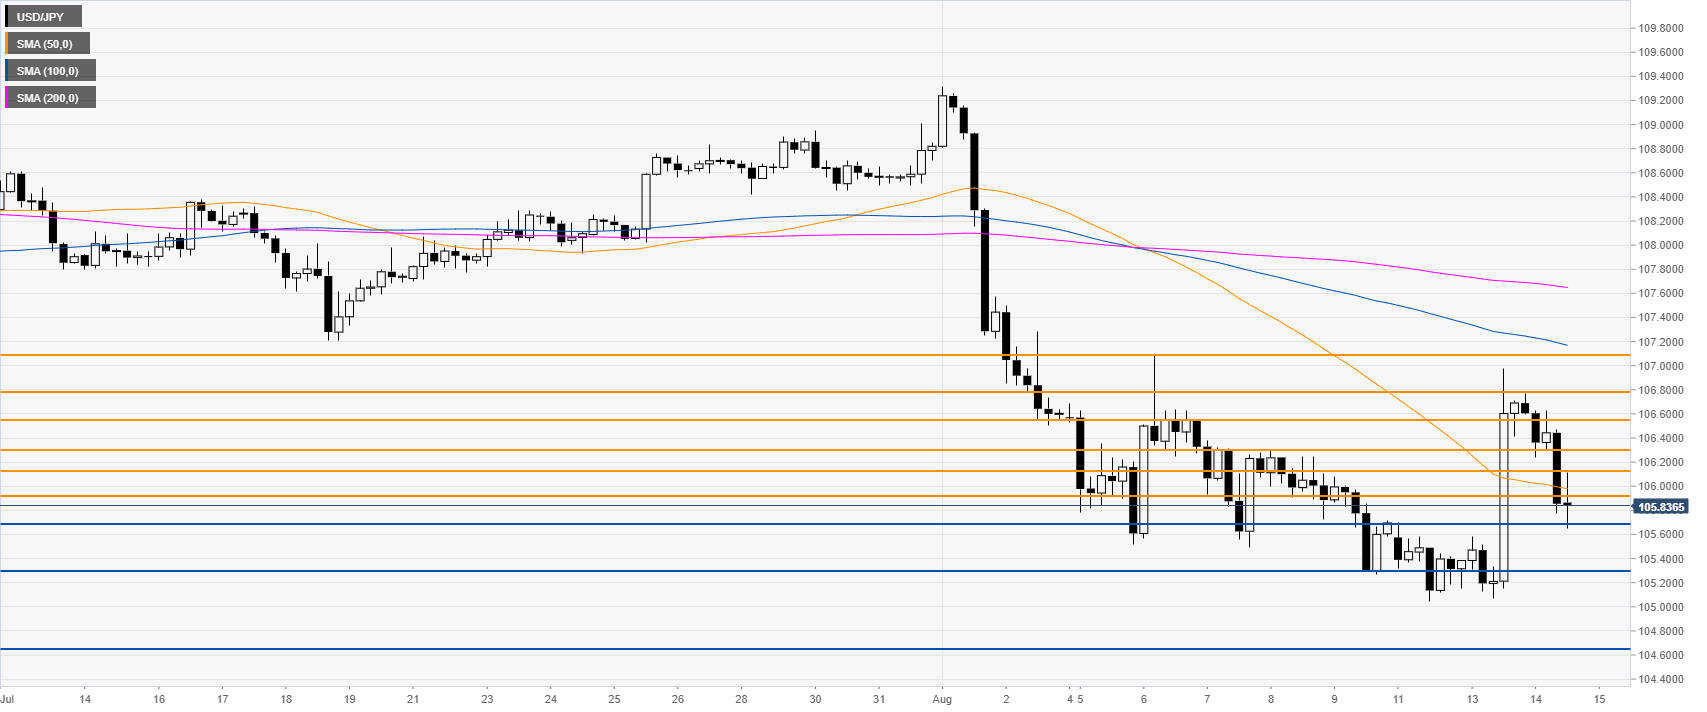
USD/JPY 4-hour chart
USD/JPY is trading below its main SMAs, suggesting bearish momentum. The market is erasing parts of the gains made on Tuesday. However, the pullback down seems overdone and the bears need to break below 105.68 to drive the market down towards 105.30, according to the Technical Confluences Indicator.
USD/JPY 30-minute chart
USD/JPY dropped to the 105.70 level near the 200 SMA. Bulls have a lot of work if they want to undo the bearish damage. They have several layers of resistances to break at 105.90, 106.12, 106.30, 106.55 and 106.77 levels, according to the Technical Confluences Indicator.
Additional key levels
