- USD/JPY is fading the Fed-inspired spike to 108.86 resistance.
- Support is seen at 108.61 and 104.41 on the way down.
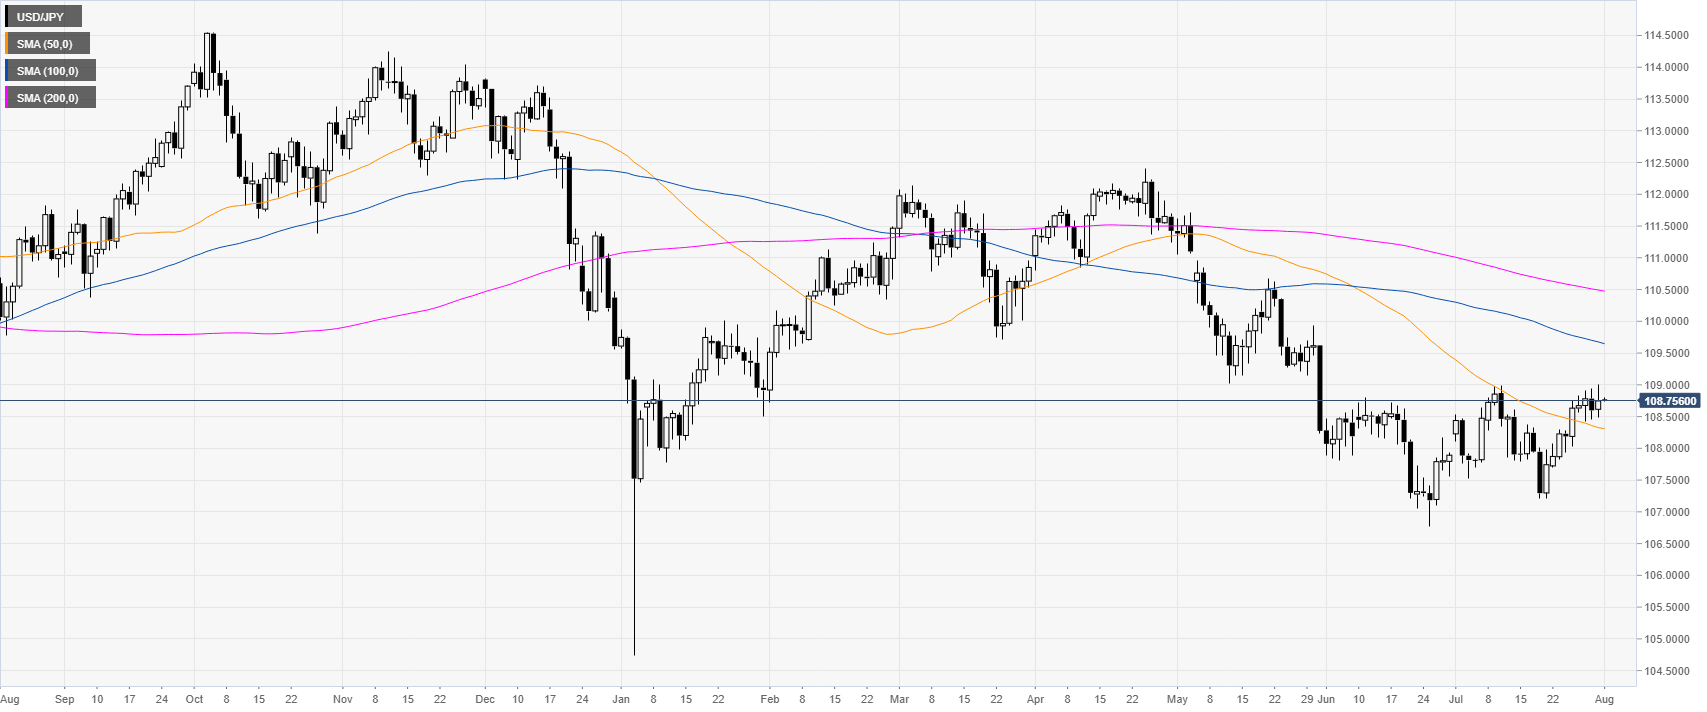
USD/JPY daily chart
USD/JPY is trading in a range above the 108.50 level and the 50 SMA. The market only had a minor reaction to the 25 bps cut by the Federal Reserve.
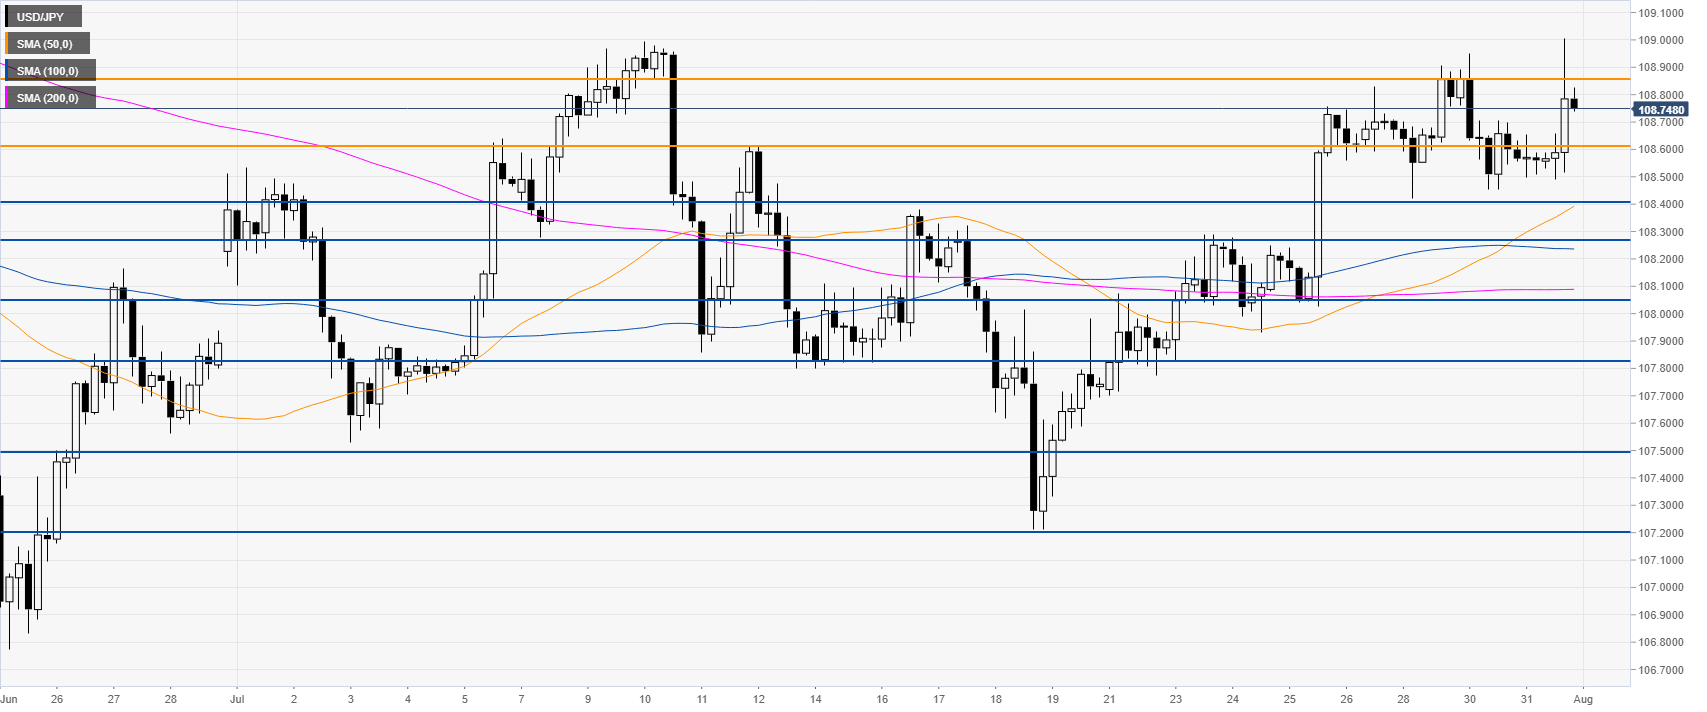
USD/JPY 4-hour chart
USD/JPY is trading above its main SMAs, suggesting a bullish bias in the medium term. Bulls need to generate a breakout above 108.86 to reach 109.40 resistance on the way up, according to the Technical Confluences Indicator.
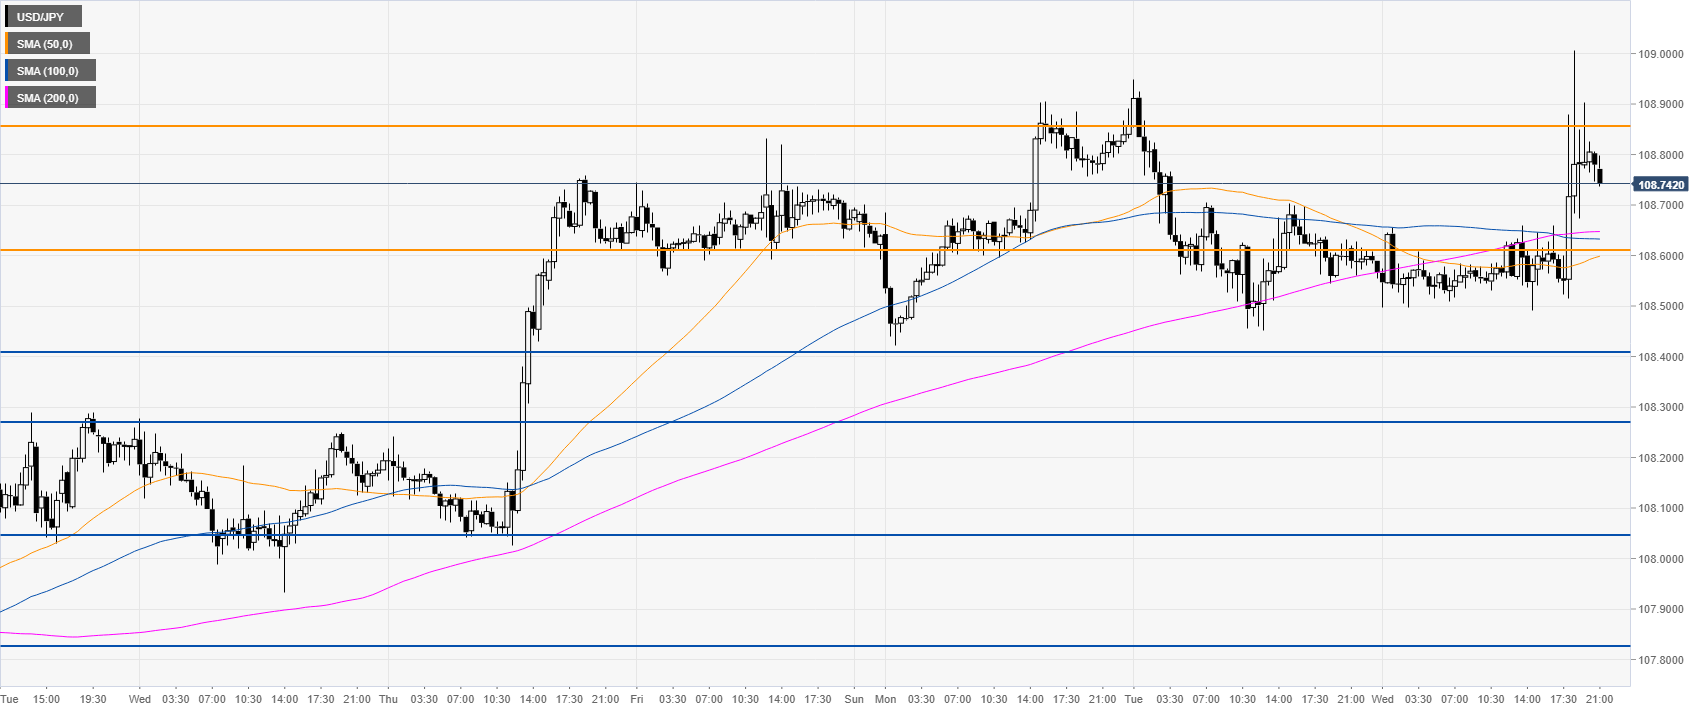
USD/JPY 30-minute chart
The market is currently fading the Fed-inspired spike to 108.86. Support on the way down is seen at 108.61 and 108.41, according to the Technical Confluences Indicator.
Additional key levels
