- USD/JPY is bouncing from the daily lows now challenging the 107.20 resistance.
- The level to beat for bulls is the 107.20/40 resistance zone.
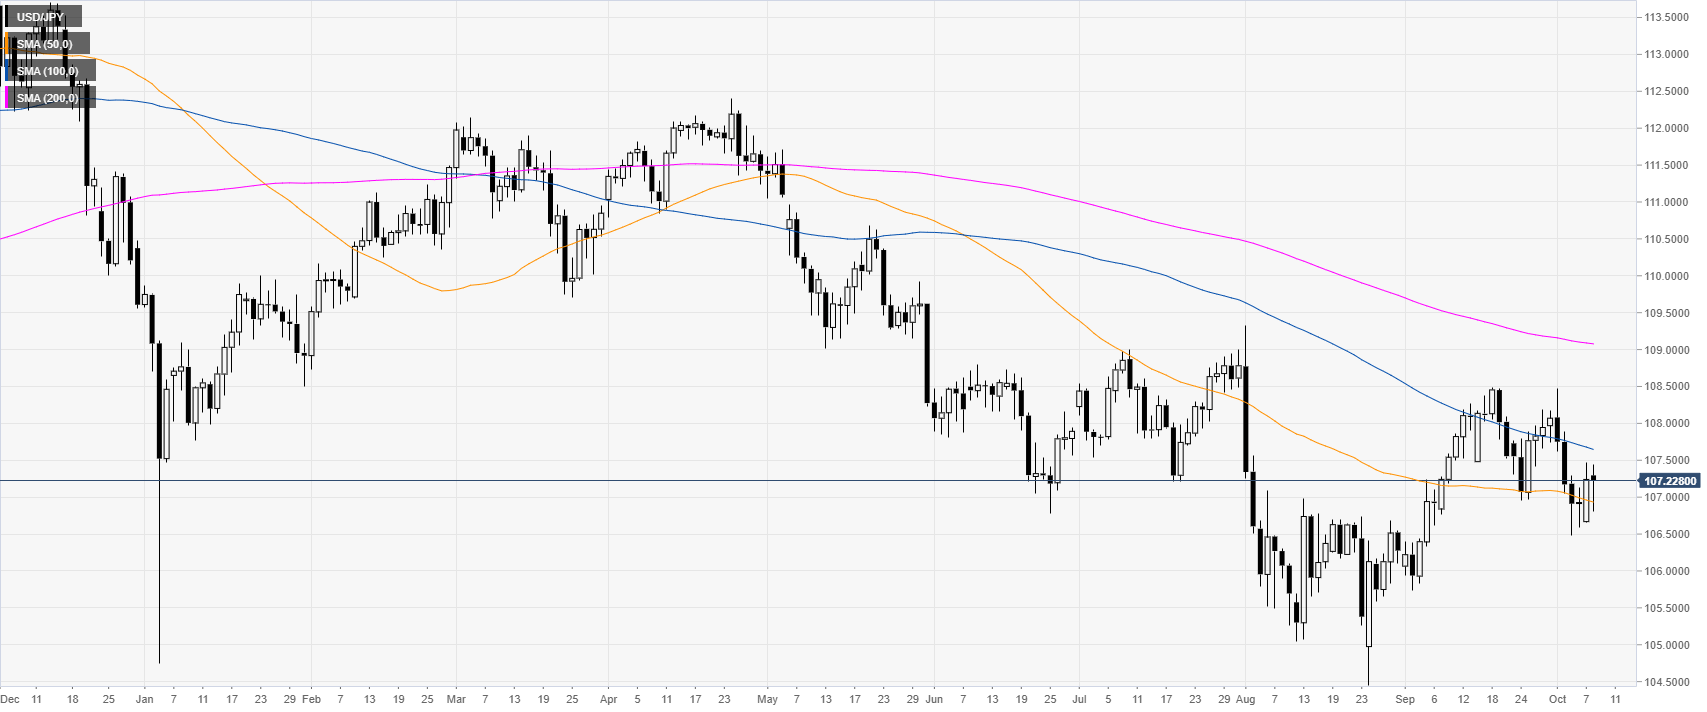
USD/JPY daily chart
USD/JPY is trading in a bear trend below the 100 and 200-day simple moving averages (DSMAs). The spot is attempting to find some support near the 50 SMA at the 106.93 level.
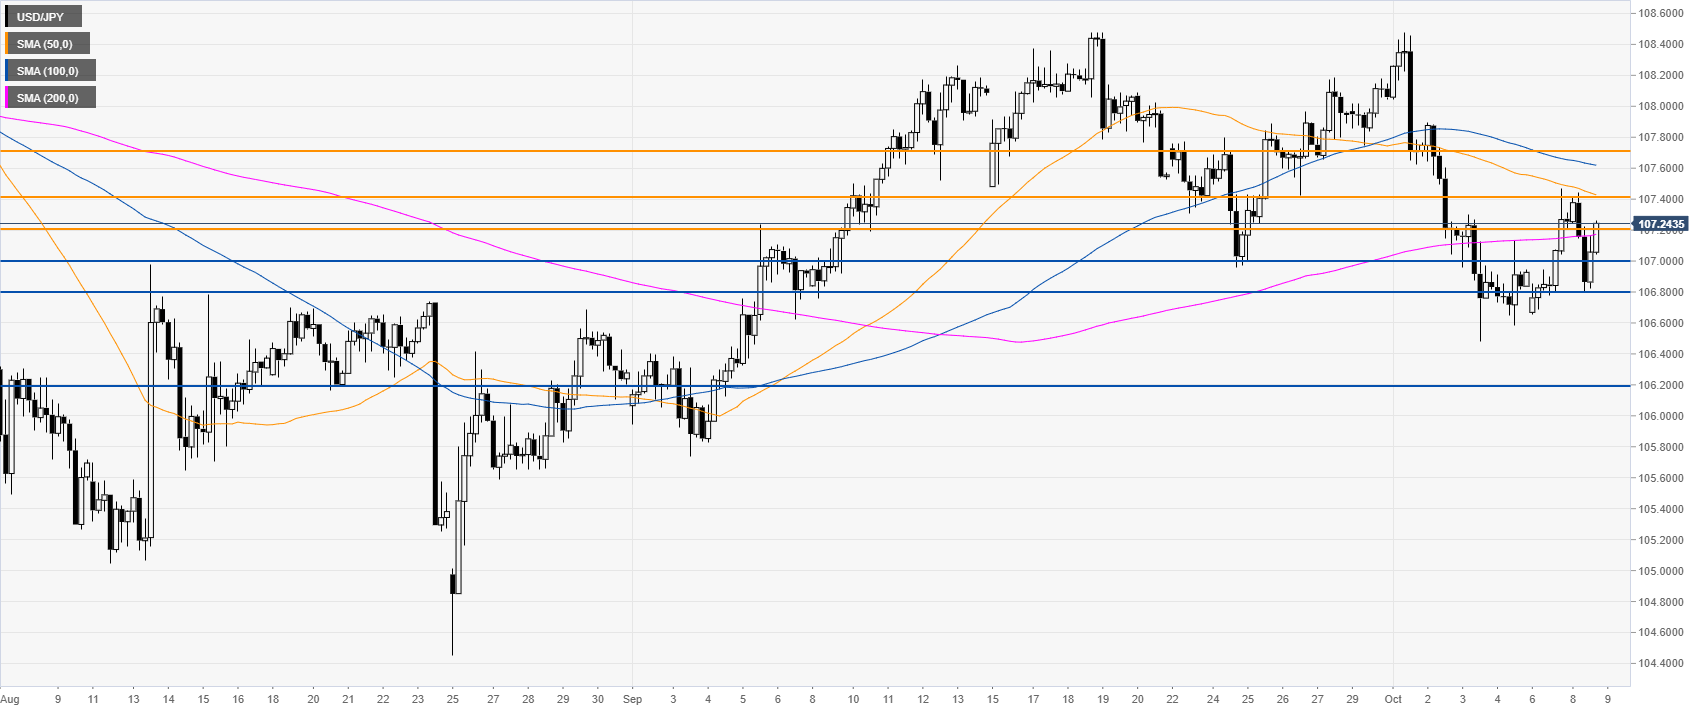
USD/JPY four-hour chart
USD/JPY is challenging the 200 SMA and the 107.20 resistance level. A break above the level can lead to the 107.40 resistance on the way up, according to the Technical Confluences Indicator. If the bulls can break 107.40, further up lie the 107.70 level.
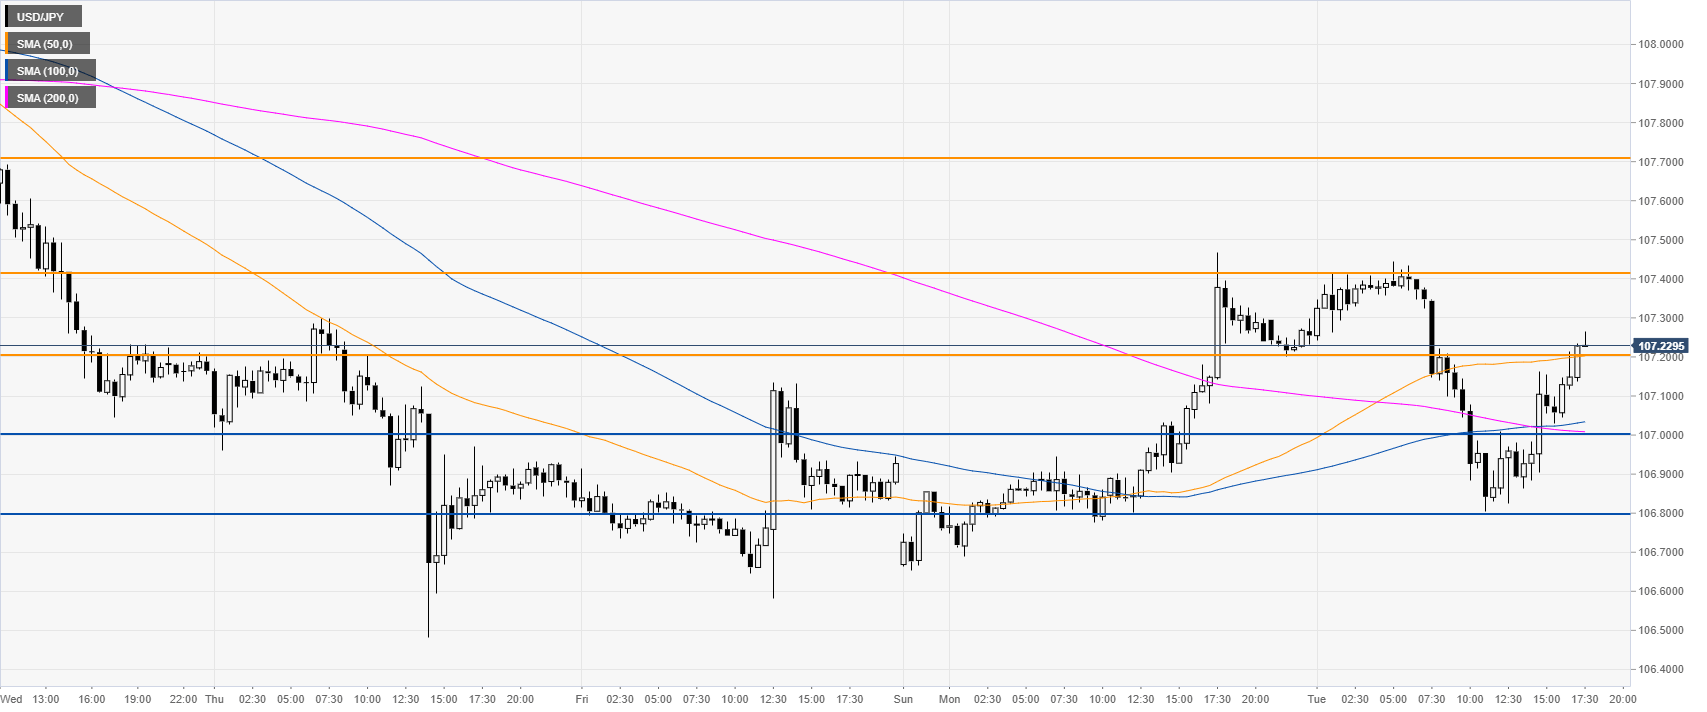
USD/JPY 30-minute chart
The USD/JPY currency pair is trading above its main SMAs, suggesting bullish momentum in the near term. Immediate supports are seen at the 107.20, 107.00 and 106.80 price levels, according to the Technical Confluences Indicator.
Additional key levels
