- USD/JPY bull trend has been on hold as the market had a pullback down.
- USD/JPY is trying to hold above the 200-period simple moving average as bulls are trying to come back and break above 112.55 (September 27 low). USD/JPY is positevly correlated to US equity indices which are moving up after the crash seen on Wednesday.
- While the bull momentum is slowly coming back, buyers would need to break above 113.00 to regain full control of the market.
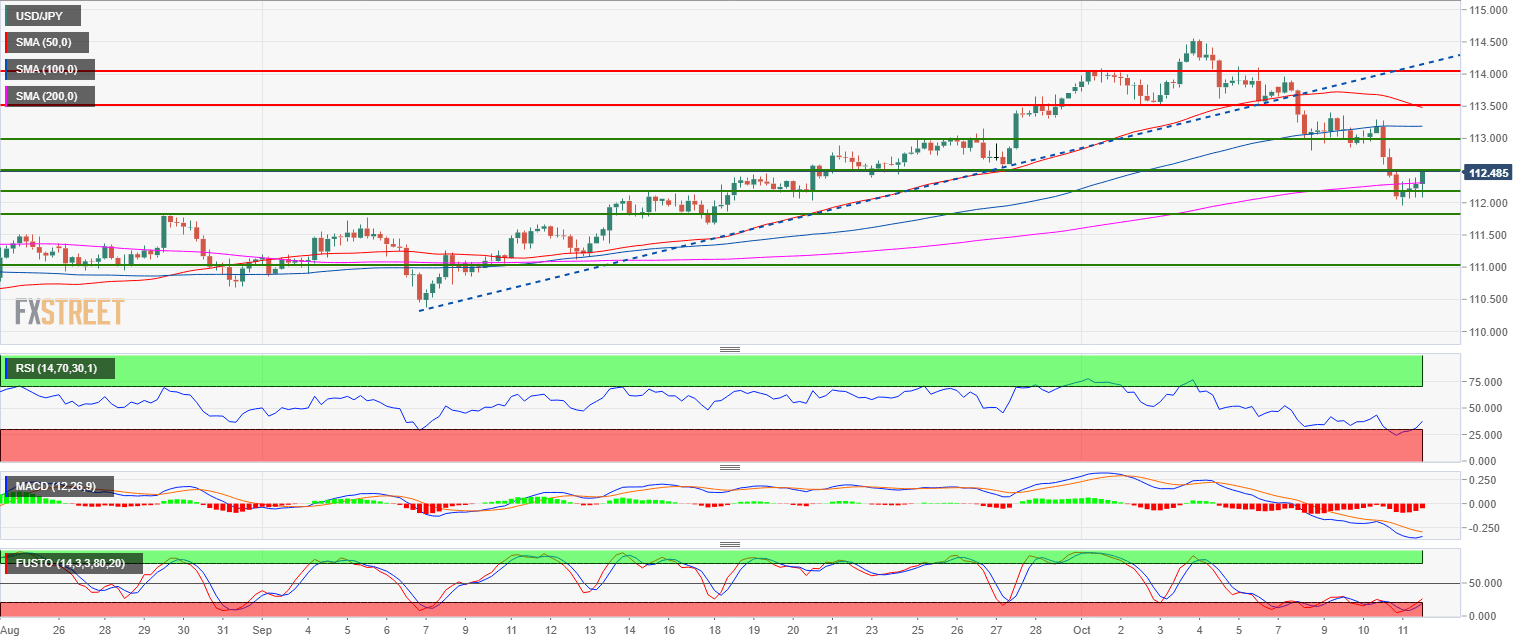
Spot rate: 112.48
Relative change: 0.20%
High: 112.53
Low: 111.97
Main trend: Bullish
Resistance 1: 112.55 September 27 low
Resistance 2: 113.00 figure
Resistance 3: 113.55 October 2 low
Resistance 4: 113.55 October 2 low
Resistance 5: 114.00 figure
Resistance 6: 114.80 November 2017 high
Resistance 7: 115.50 March 10, 2017 high
Support 1: 112.00-112.17 zone, figure and August 1 swing high
Support 2: 111.84 August 29 swing high
Support 3: 111.00 figure
