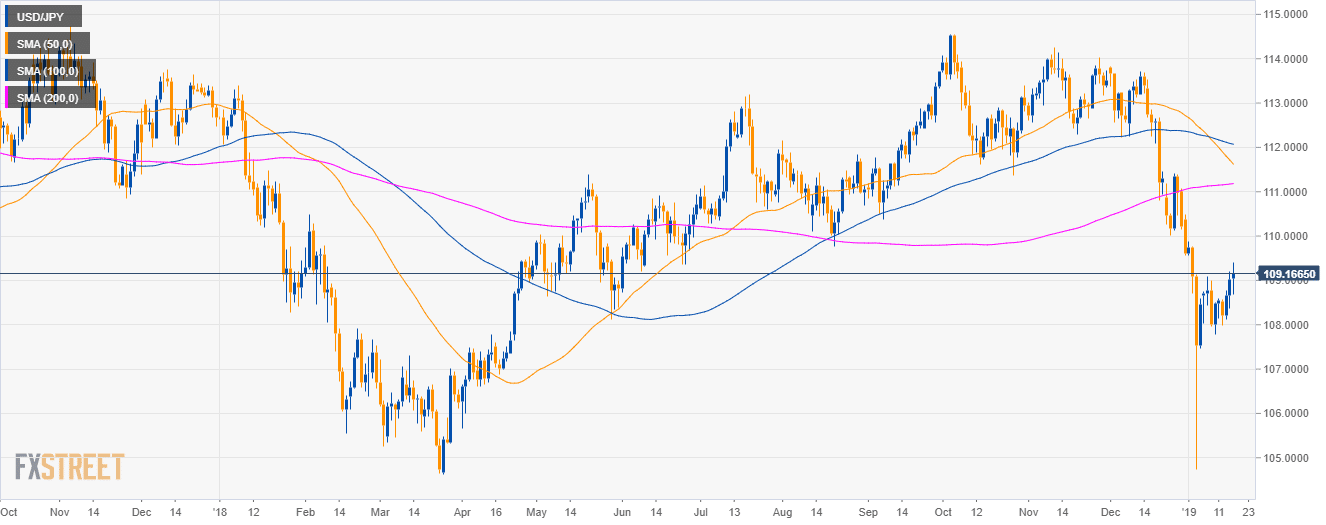
USD/JPY daily chart
- USD/JPY is trading in a deep pullback below the 50, 100 and 200-period simple moving averages (SMAs).
- USD/JPY spiked 40 pips to the upside as the Wall Street Journal reported that the US considers lifting China tariffs.
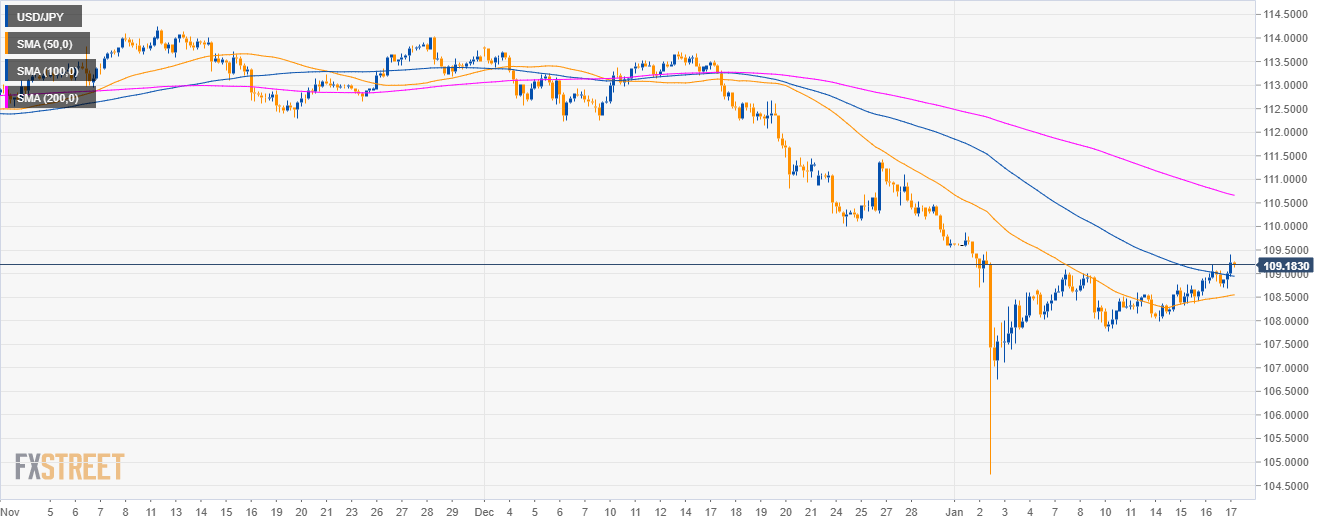
USD/JPY 4-hour chart
- Bulls have reclaimed the 50 and 100 SMAs.
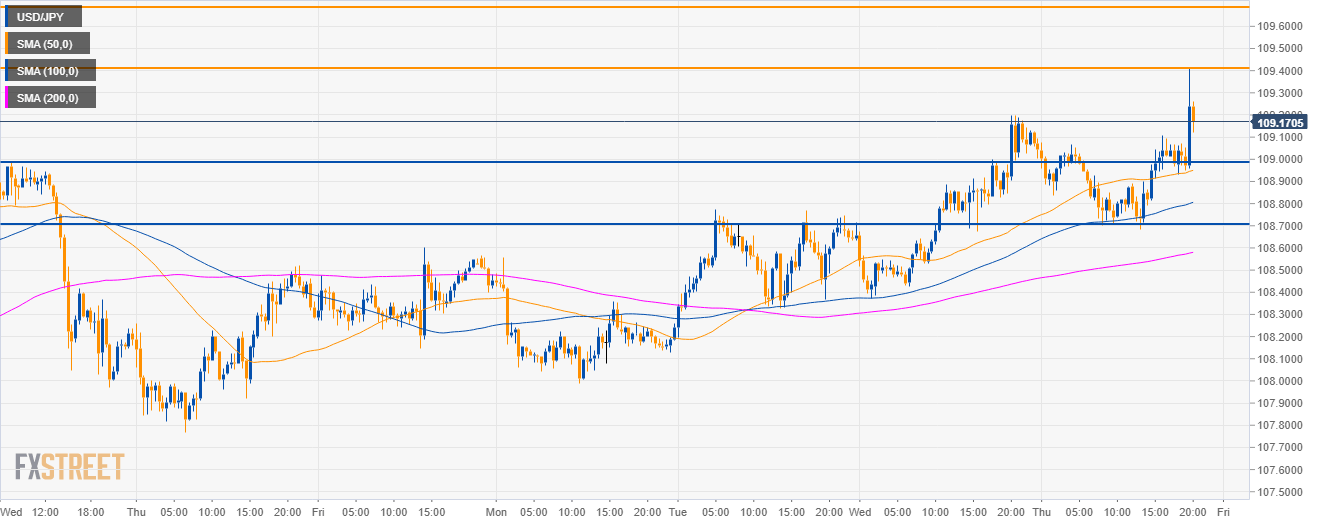
USD/JPY 30-minute chart
- As the spike up is being quickly retrcaced, bears might bring the market back to 109.00 and 108.70 supports.
Additional key levels
USD/JPY
Overview:
Today Last Price: 109.24
Today Daily change: 20 pips
Today Daily change %: 0.193%
Today Daily Open: 109.03
Trends:
Daily SMA20: 109.43
Daily SMA50: 111.71
Daily SMA100: 112.09
Daily SMA200: 111.17
Levels:
Previous Daily High: 109.2
Previous Daily Low: 108.37
Previous Weekly High: 109.09
Previous Weekly Low: 107.77
Previous Monthly High: 113.83
Previous Monthly Low: 109.55
Daily Fibonacci 38.2%: 108.88
Daily Fibonacci 61.8%: 108.69
Daily Pivot Point S1: 108.53
Daily Pivot Point S2: 108.04
Daily Pivot Point S3: 107.71
Daily Pivot Point R1: 109.36
Daily Pivot Point R2: 109.69
Daily Pivot Point R3: 110.19
