- USD/JPY dropped sharply as the US ISM Manufacturing PMI data fell to its lowest in 10 years.
- The level to beat for sellers is the 107.60 support level.
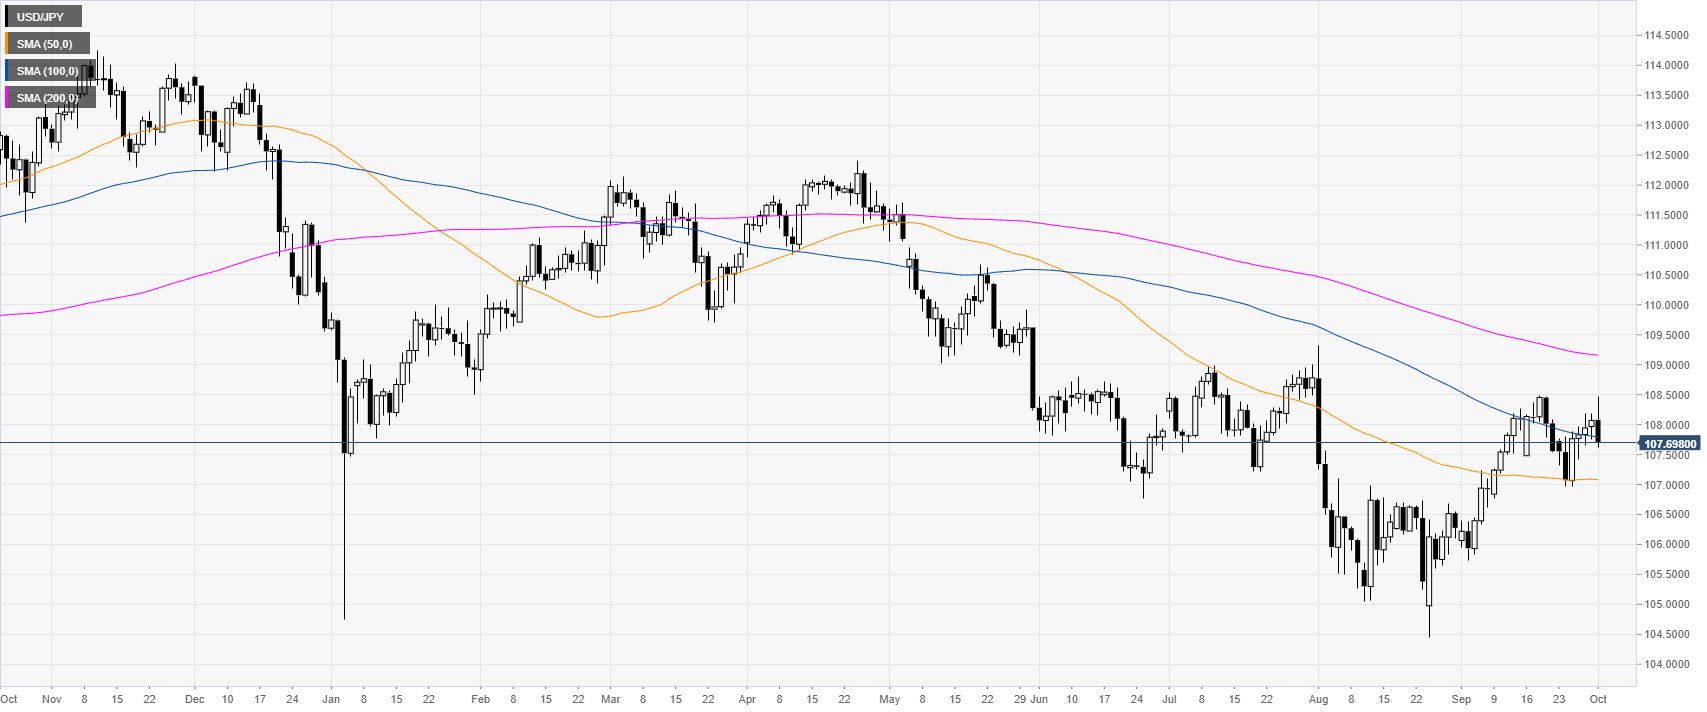
USD/JPY daily chart
USD/JPY is in a bear trend below the 100 and 200-day simple moving averages (SMAs). The market is currently trading below the September highs and the 108.00 handle. This Tuesday, the ISM Manufacturing PMI came in below forecast at 47.8 vs. 50.1 in September, which was the worst reading since 2009.
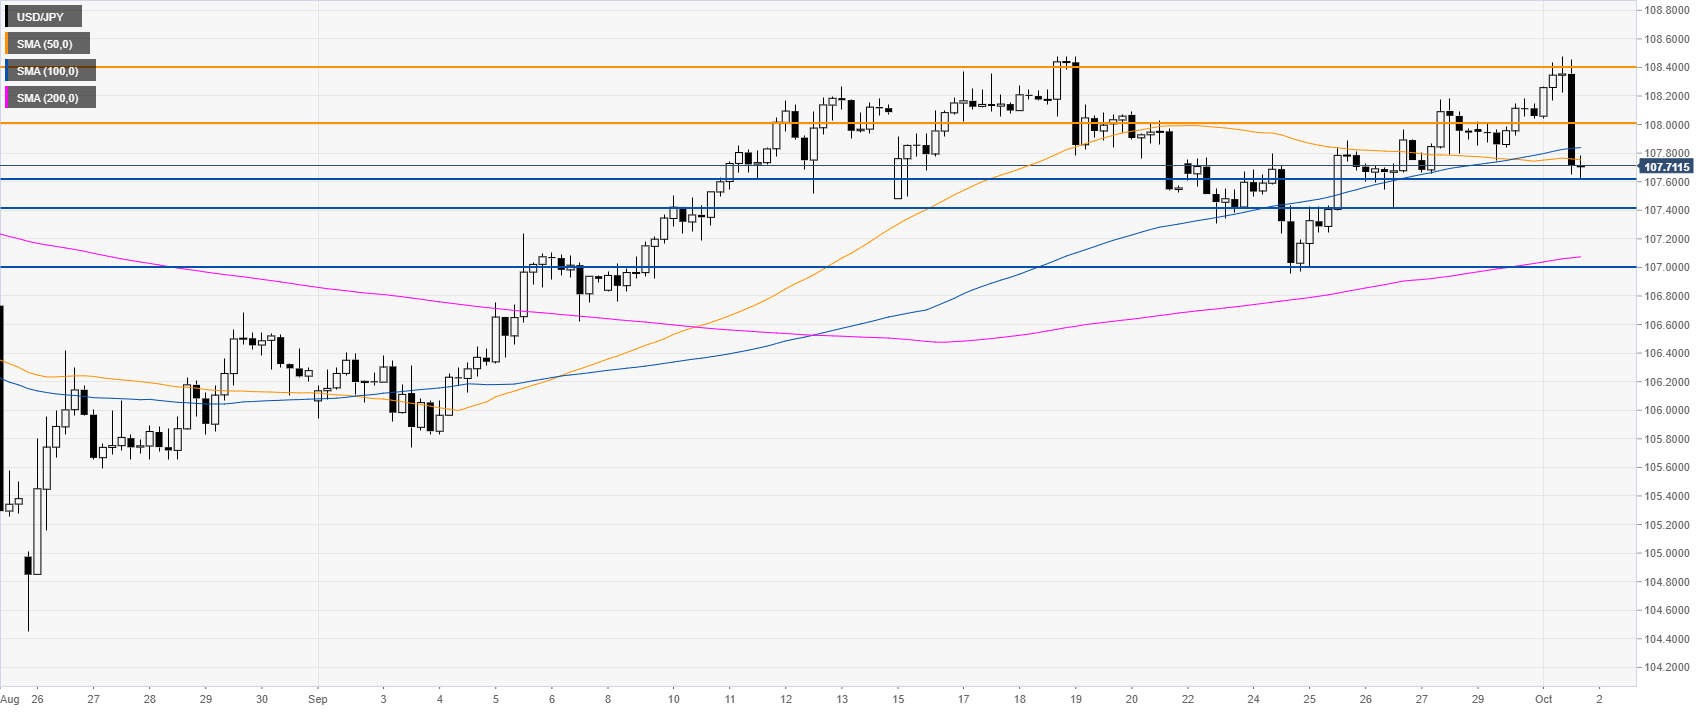
USD/JPY 4-hour chart
USD/JPY dropped sharply below the 108.00 handle and the 50/100 SMAs, suggesting a continuation down in the medium term. A break of 107.60 can expose the 107.40 and 107.00 support levels, according to the Technical Confluences Indicator.
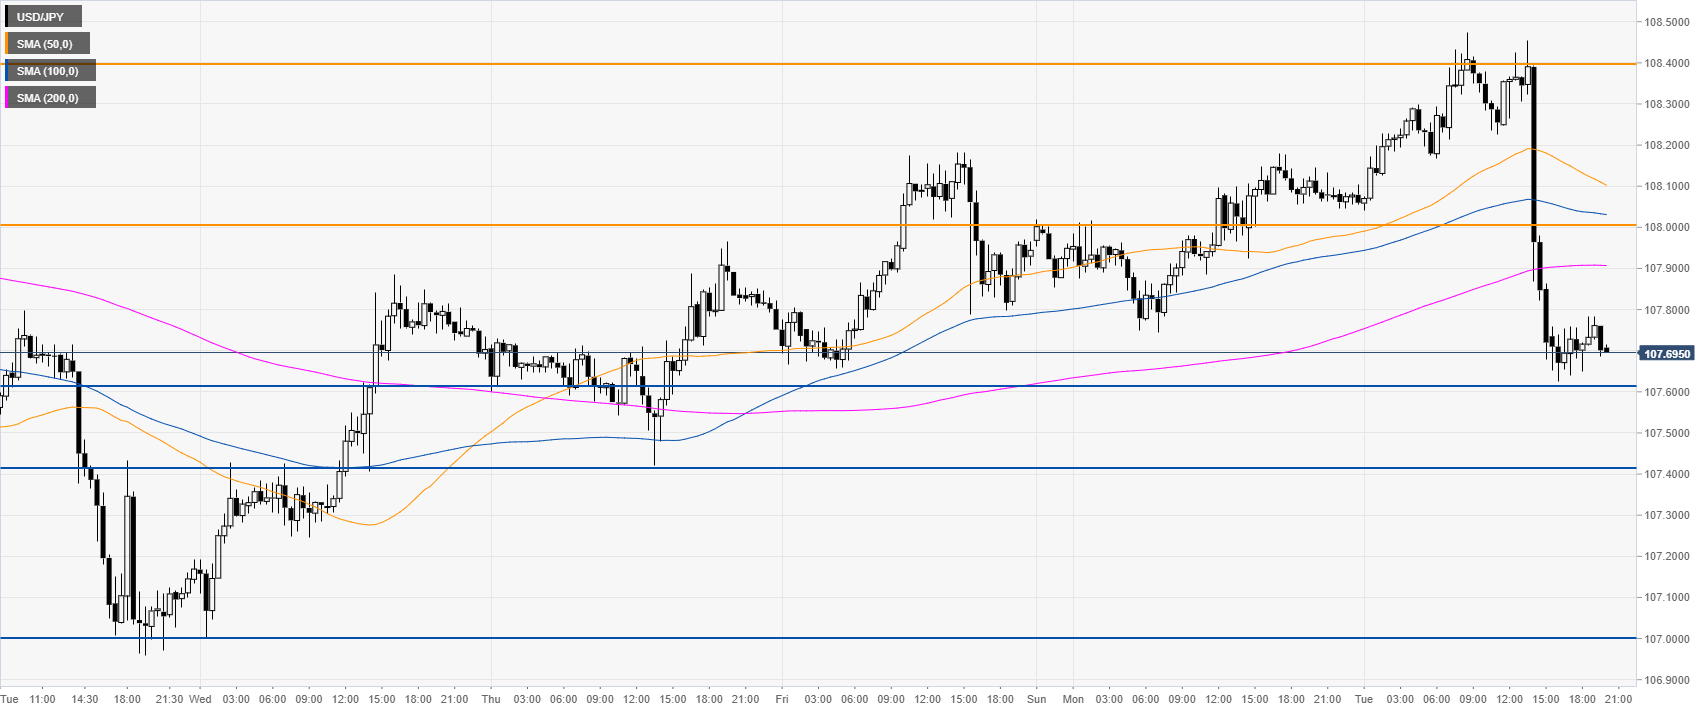
USD/JPY 30-minute chart
USD/JPY is trading below the main SMAs, suggesting a downward bias in the near term. Immediate resistances are seen at the 108.00 and 108.40 price levels, according to the Technical Confluences Indicator.
Additional key levels
