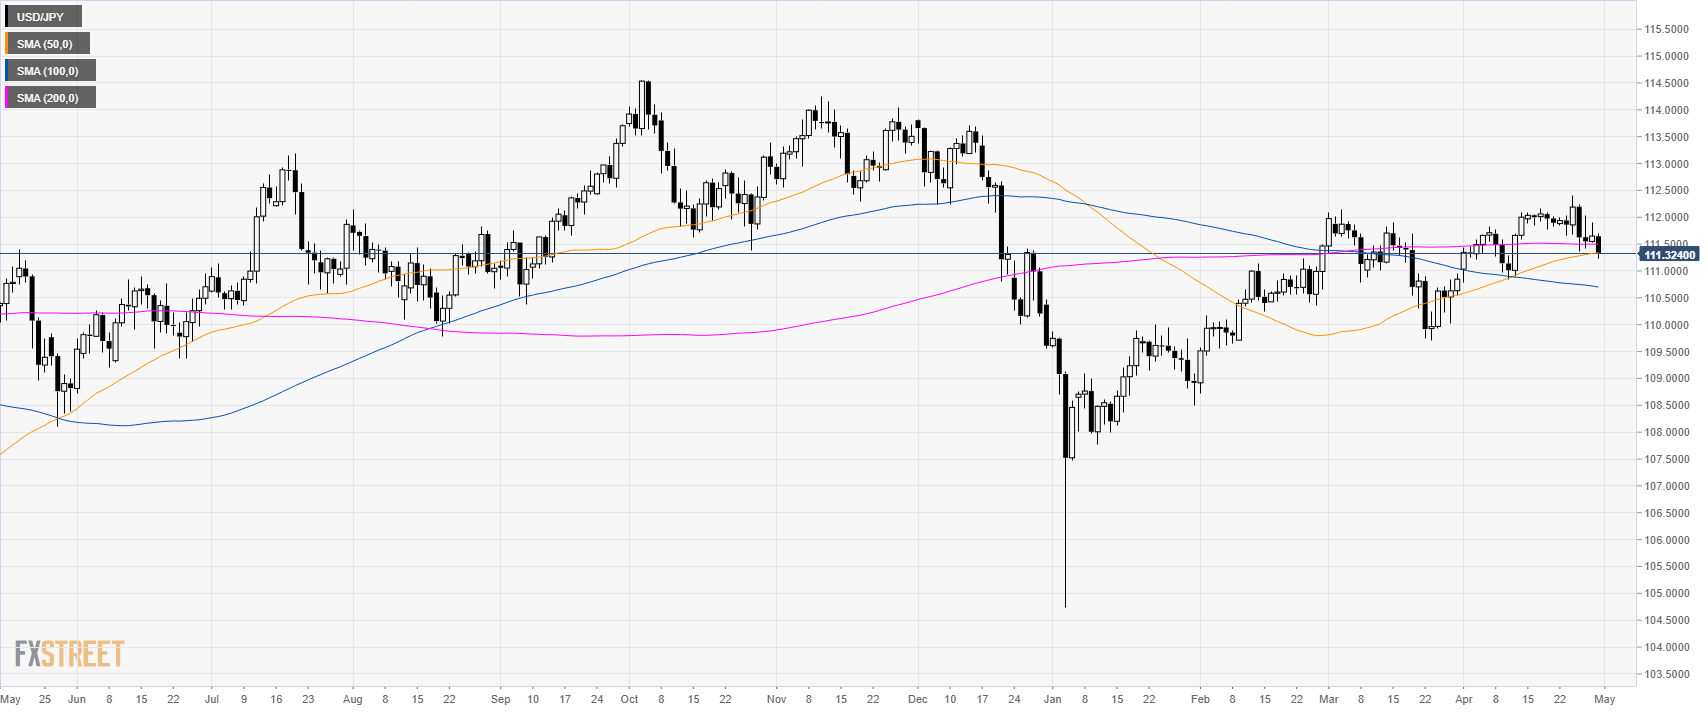
Home USD/JPY Technical Analysis: Greenback losing some steam below the 112.00 mark
FXStreet News

USD/JPY Technical Analysis: Greenback losing some steam below the 112.00 mark

USD/JPY daily chart

  • USD/JPY is testing the 50-day simple moving average.

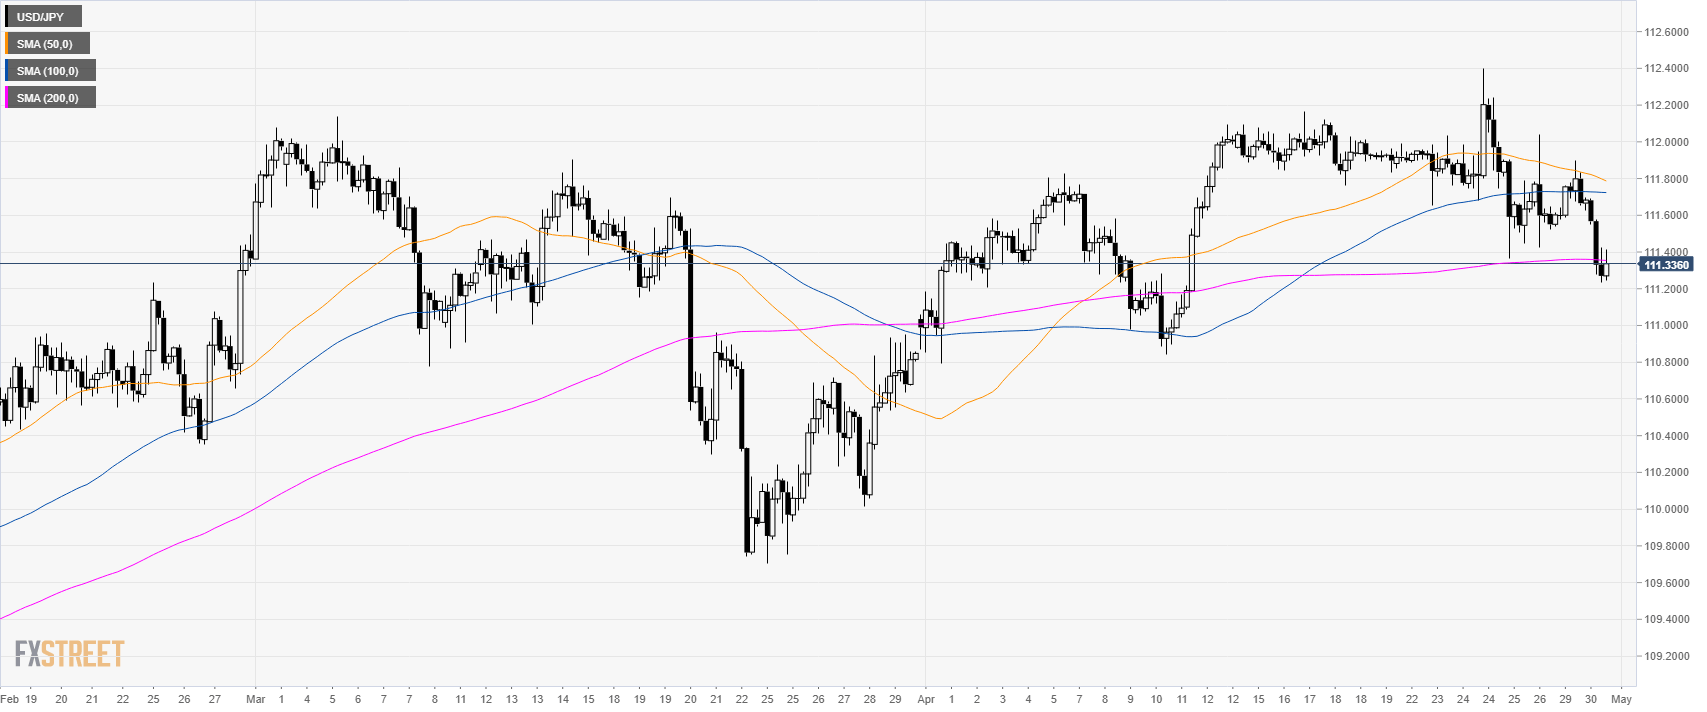
USD/JPY 4-hour chart

  • USD/JPY is challenging the 200 SMA as the market is trading below the 50 and 100 SMA.

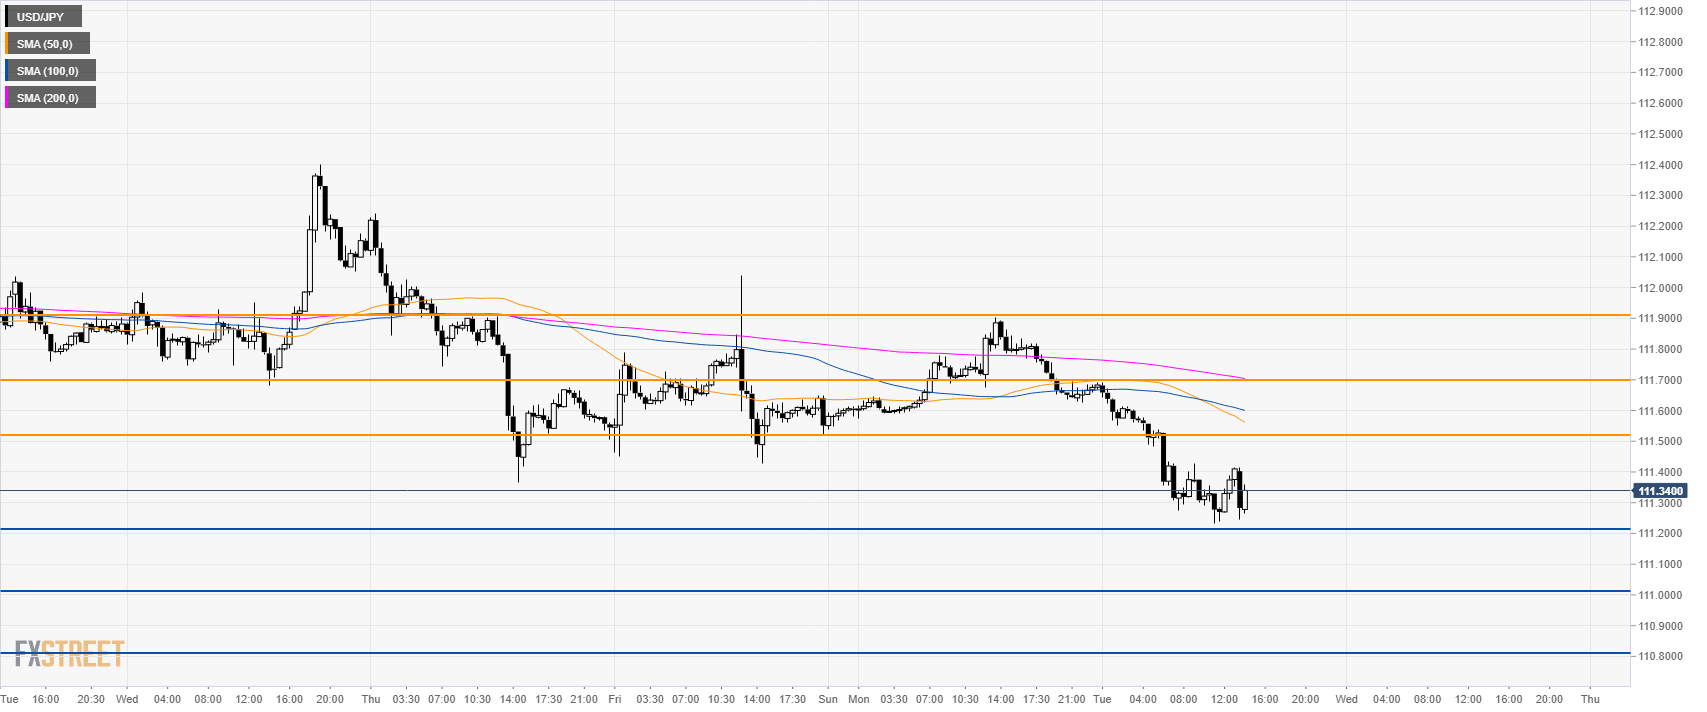
USD/JPY 30-minute chart

  • USD/JPY is trading below its main SMAs suggesting bearish momentum in the short-term.
  • Bears need to break below 111.20 to the downside to reach 111.00, 110.80 support.  
  • Alternatively, a rebound from 111.20 would meet initial resistance  at 111.50/70 and 111.90 level.

Additional key levels


FX Street

FX Street

FXStreet is the leading independent portal dedicated to the Foreign Exchange (Forex) market. It was launched in 2000 and the portal has always been proud of their unyielding commitment to provide objective and unbiased information, to enable their users to take better and more confident decisions.