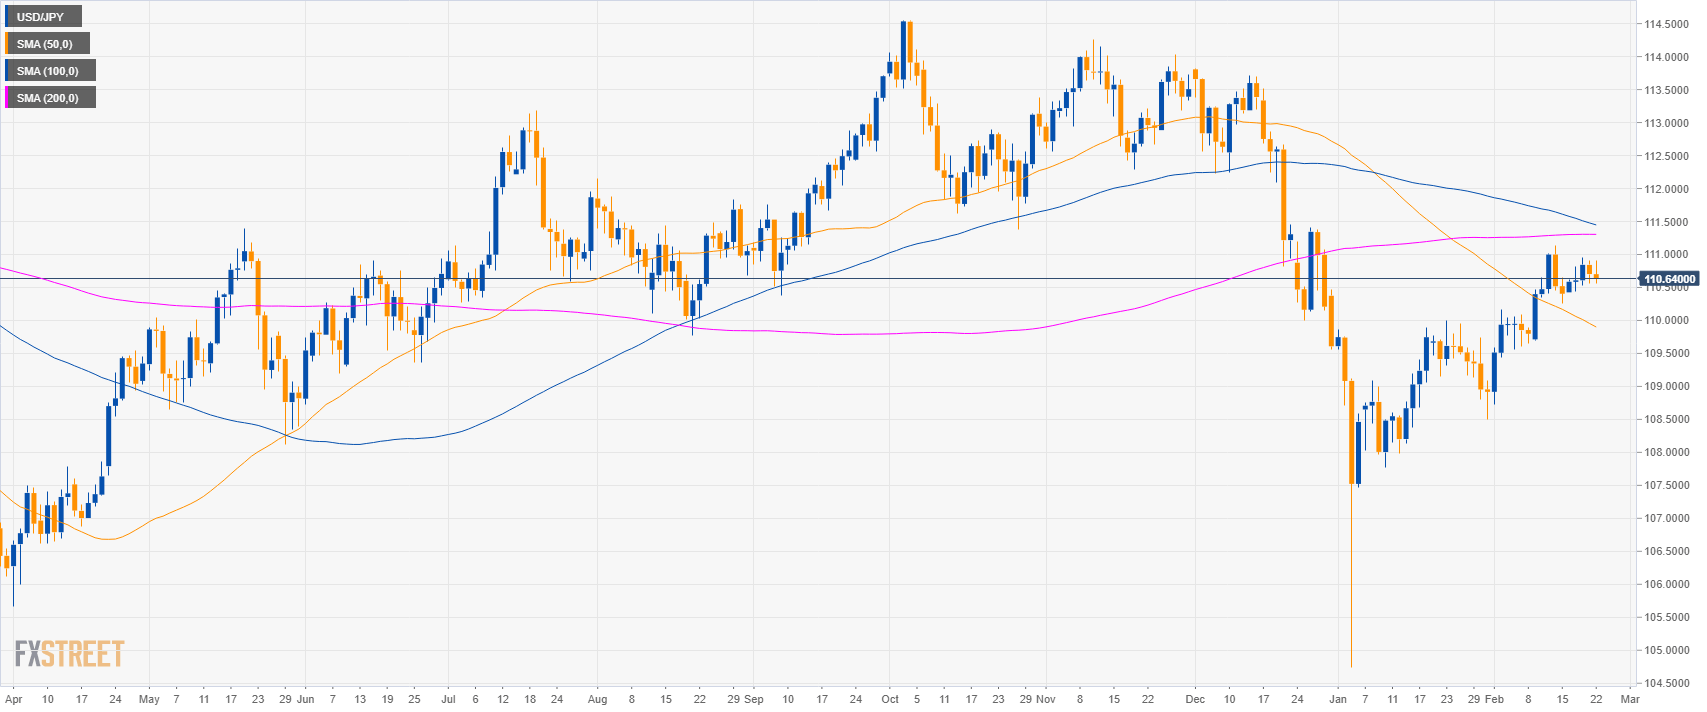
USD/JPY daily chart
- USD/JPY is trading in a deep pullback below the 200-day simple moving averages (SMAs) on the daily chart.
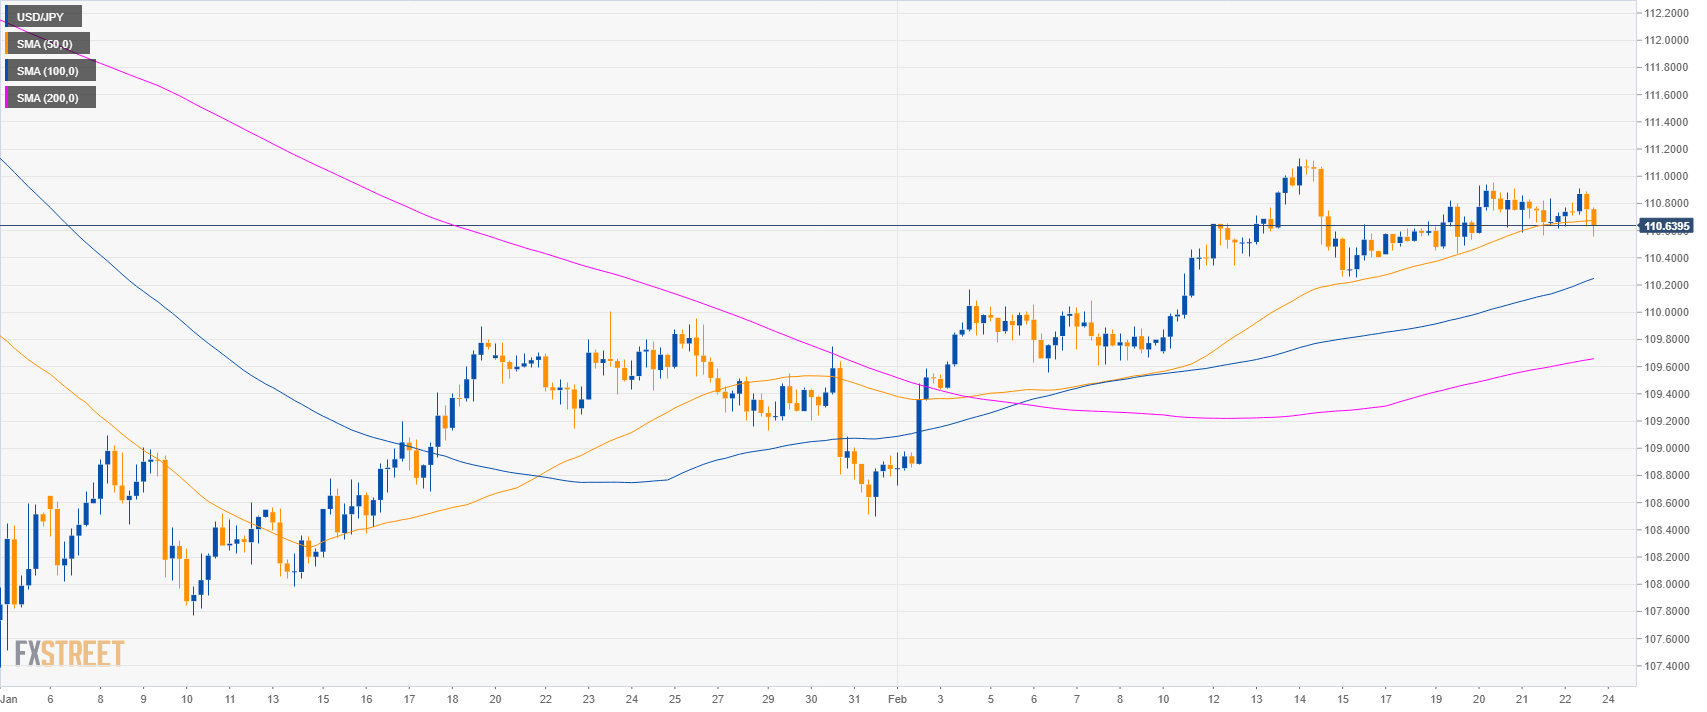
USD/JPY 4-hour chart
- USD/JPY is trading below the 50 SMAs suggesting a weakening of the bullish momentum in the medium-term.
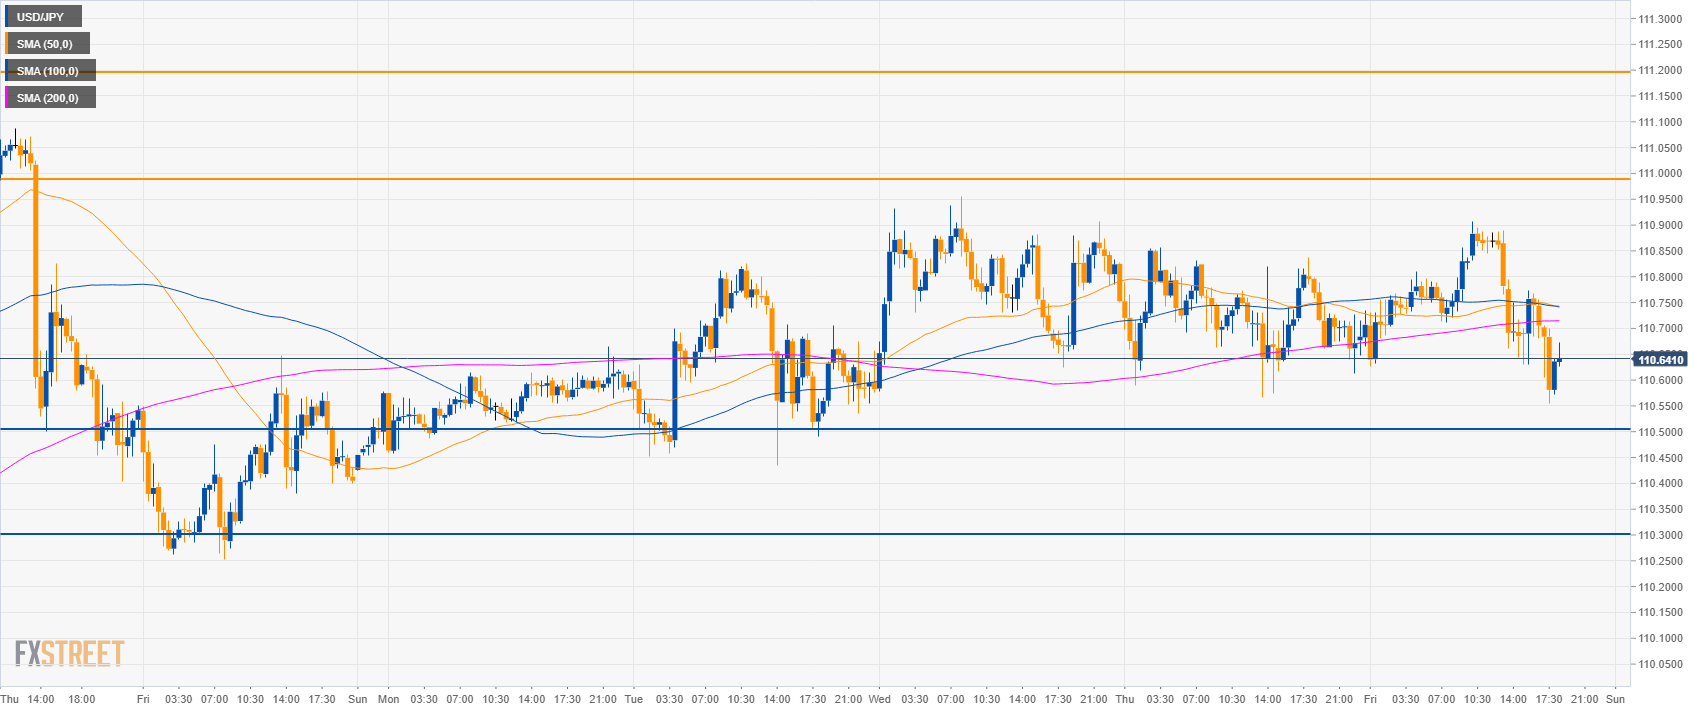
USD/JPY 30-minute chart
- USD/JPY is trading below the main SMAs suggesting bearish momentum in the short-term.
- To the downside, the market can reach 110.50 and 110.30 level in the coming sessions.
- Resistance is at 111.00 and 111.50 level.
Additional key levels:
USD/JPY
Overview:
Today Last Price: 110.66
Today Daily change: -4 pips
Today Daily change %: -0.04%
Today Daily Open: 110.7
Trends:
Daily SMA20: 110.03
Daily SMA50: 109.96
Daily SMA100: 111.48
Daily SMA200: 111.31
Levels:
Previous Daily High: 110.91
Previous Daily Low: 110.57
Previous Weekly High: 111.13
Previous Weekly Low: 109.7
Previous Monthly High: 110
Previous Monthly Low: 104.75
Daily Fibonacci 38.2%: 110.7
Daily Fibonacci 61.8%: 110.78
Daily Pivot Point S1: 110.54
Daily Pivot Point S2: 110.38
Daily Pivot Point S3: 110.2
Daily Pivot Point R1: 110.89
Daily Pivot Point R2: 111.07
Daily Pivot Point R3: 111.23
