- USD/JPY is having a bonce above the 107.00 handle.
- The level to beat for bulls is at 107.45.
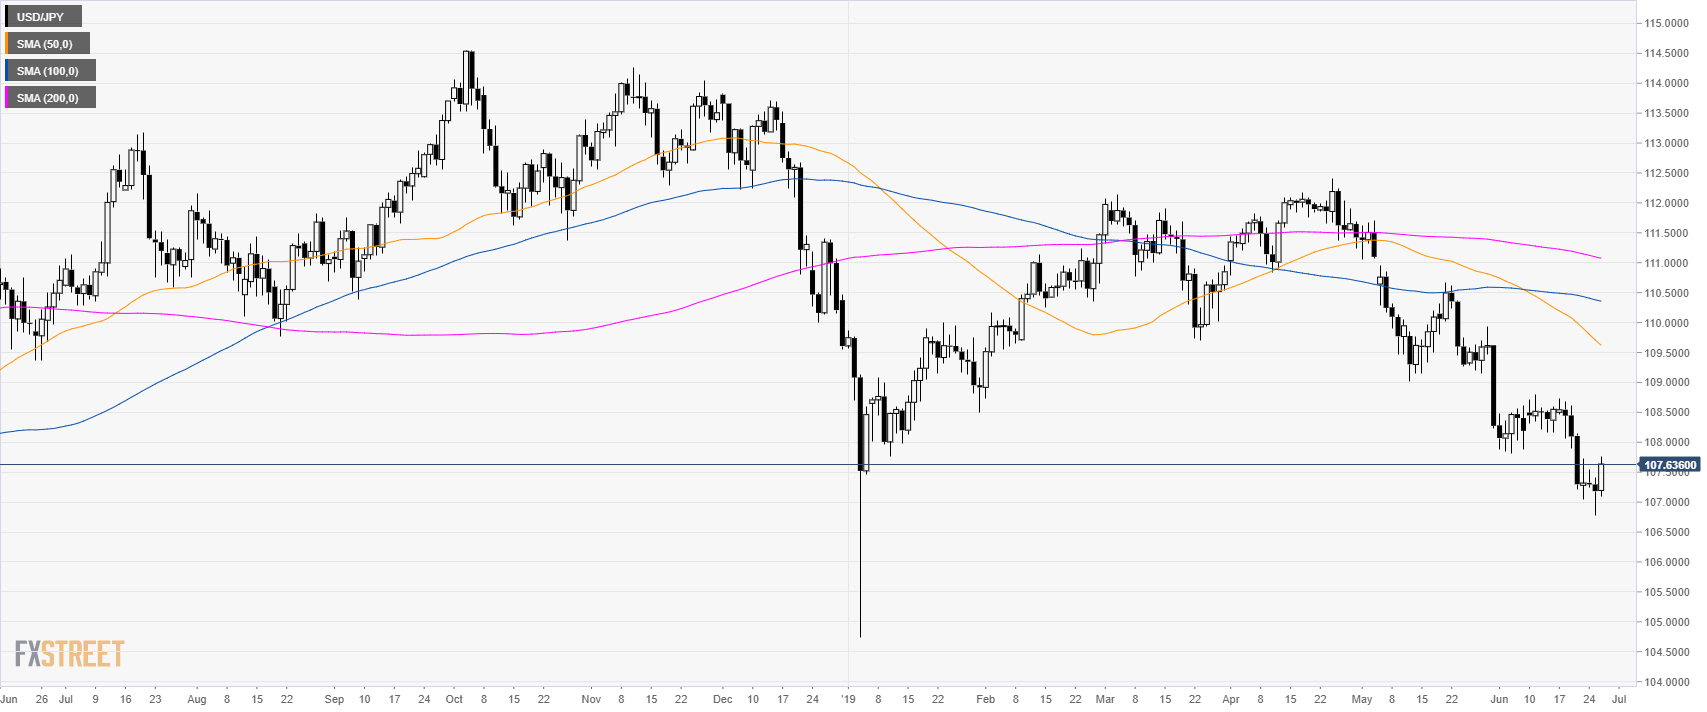
USD/JPY daily chart
USD/JPY is in a bear trend below its main daily simple moving averages (DSMAs). The 50 DSMA crossed below the 100 DSMA which is seen as a bearish clue.

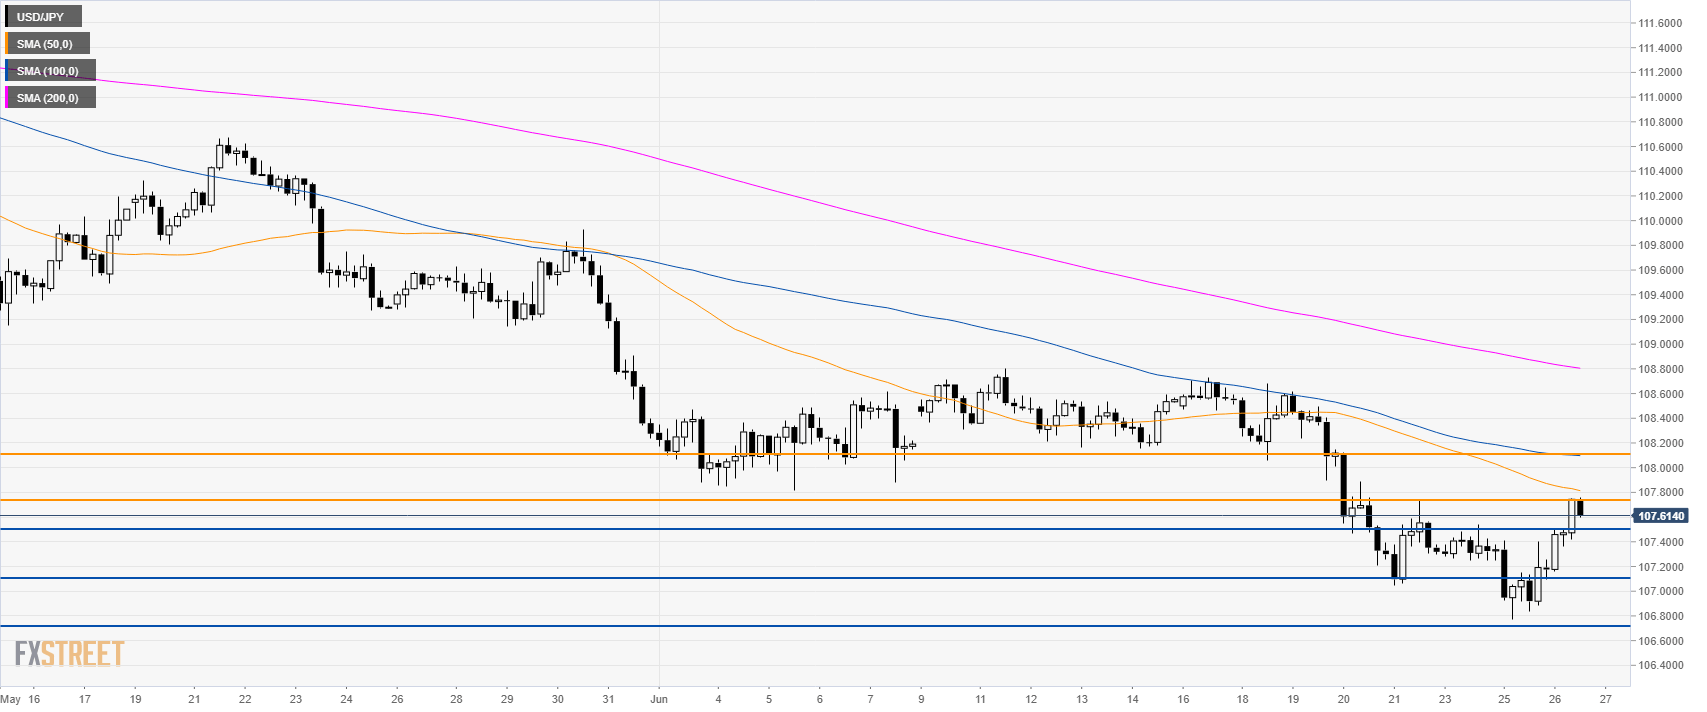
USD/JPY 4-hour chart
USD/JPY is trading below its main SMAs suggesting bearish momentum in the medium term. Support is at 107.50, 107.10 and 106.70 according to the Technical Confluences Indicator.
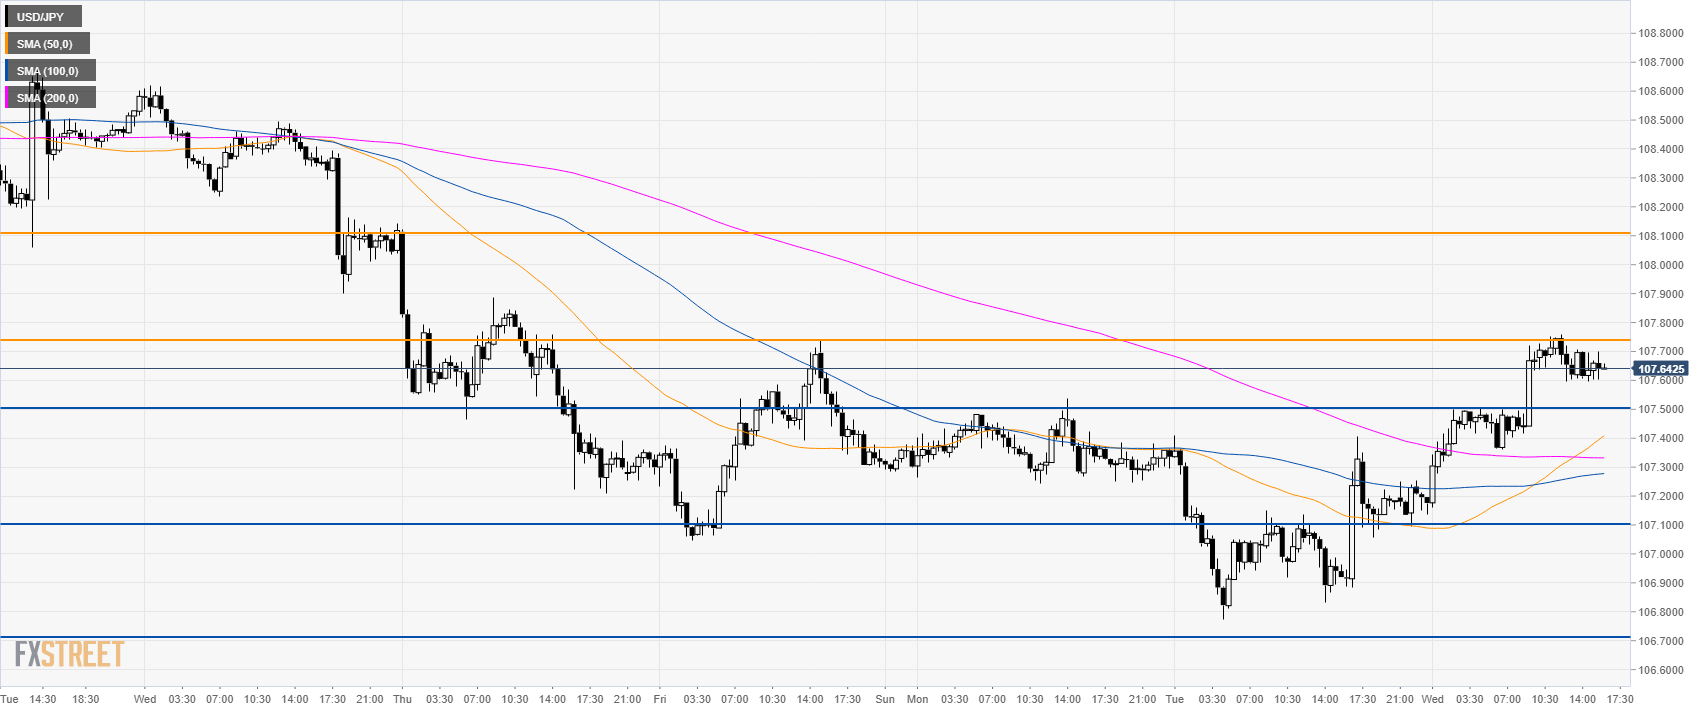
USD/JPY 30-minute chart
USD/JPY is trading above the 107.50 mark and its main SMAs suggesting bullish momentum in the near term. A break above 107.75 could open the gates to 108.10 resistance according to the Technical Confluences Indicator.
Additional key levels