- USD/JPY reversed its intraday losses and bounced above the 108.00 figure.
- 108.60 is the level to beat for bulls.
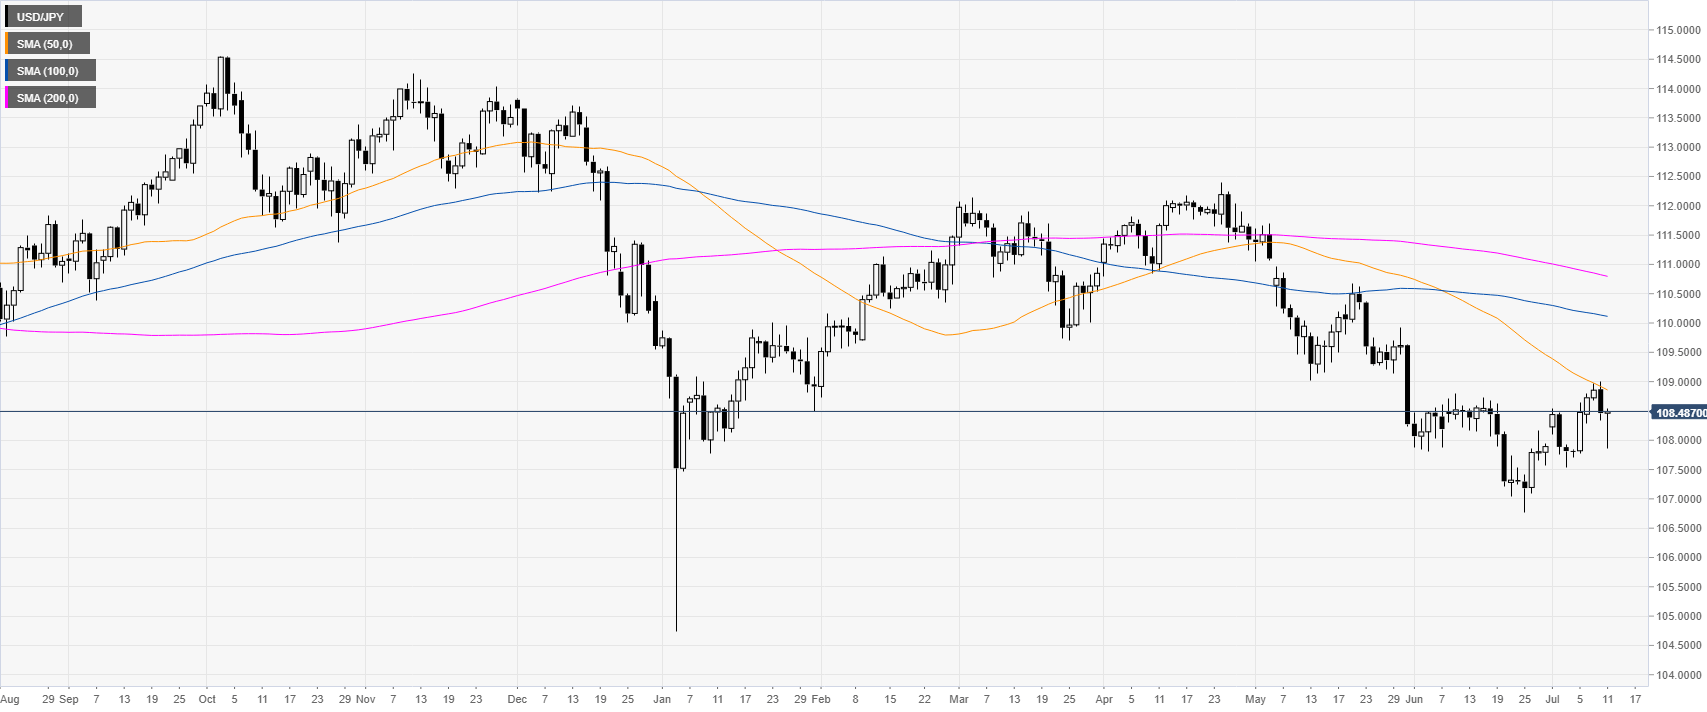
USD/JPY daily chart
USD/JPY is trading in a bull leg below the main daily simple moving average (DSMA). The market is rebounding from the 108.00 figure.
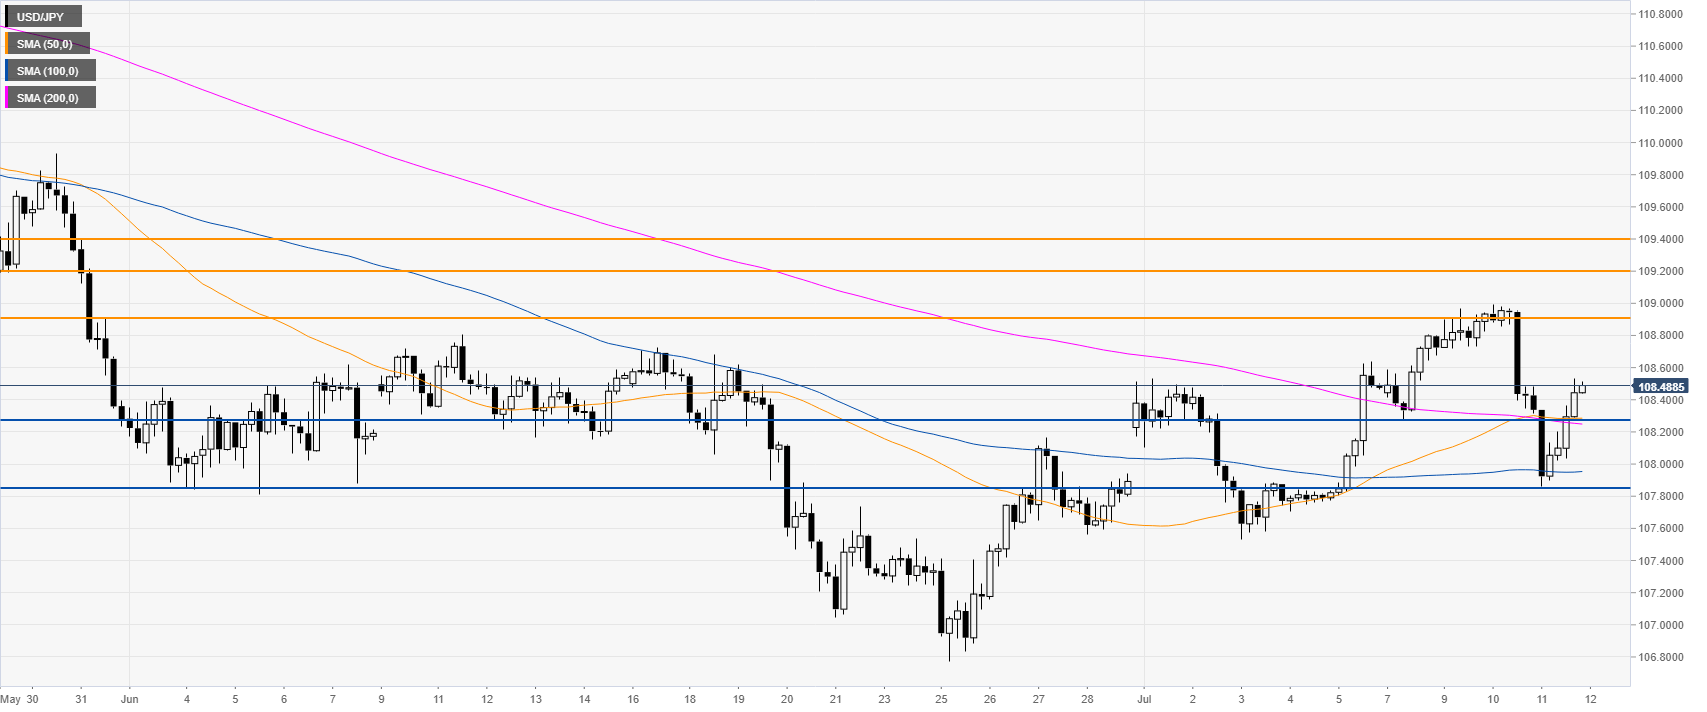
USD/JPY 4-hour chart
The market is trading above its main SMAs suggesting bullish momentum. Bulls need to break above 108.60 to reach 108.90 on the way up, according to the Technical Confluences Indicator.
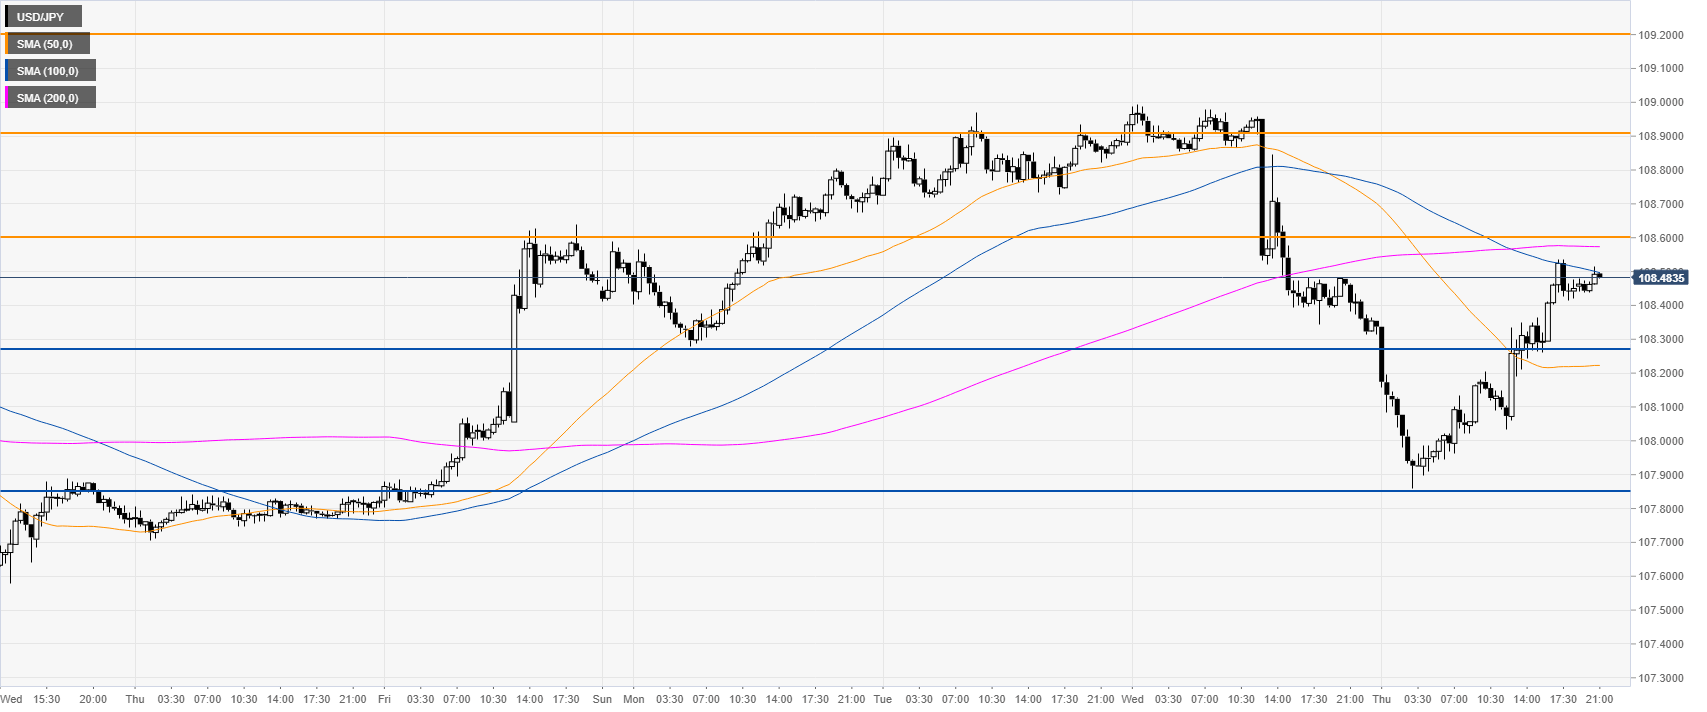
USD/JPY 30-minute chart
USD/JPY is trading between the 50 and 100 SMAs suggesting a consolidation in the near term.
Immediate support can be seen at 108.28 and 107.85, according to the Technical Confluences Indicator.

Additional key levels