- USD/JPY is off the monthly high below the 108.50 resistance.
- The current retracement could extend to 108.41 and the 108.03 support levels.
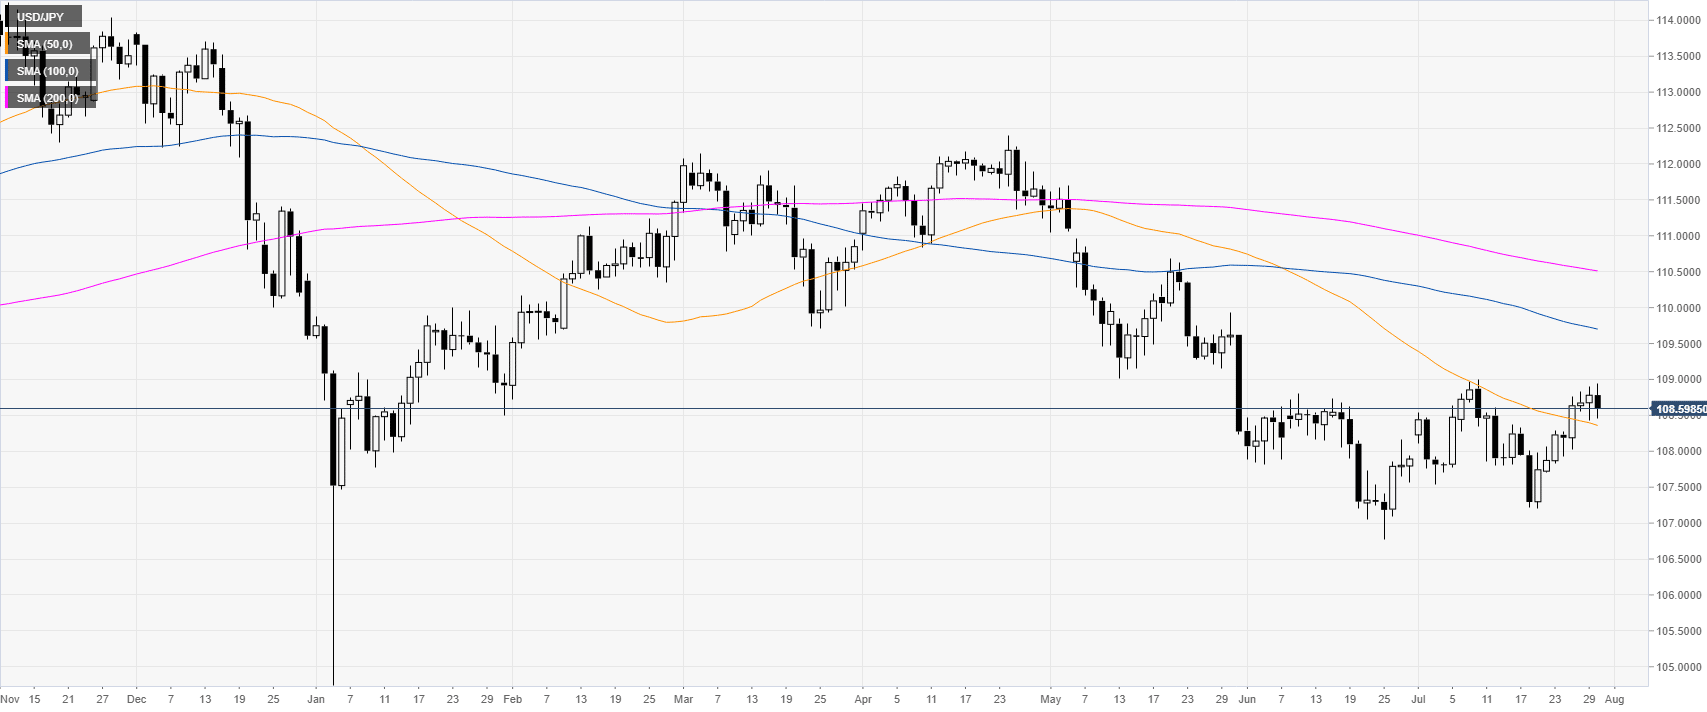
USD/JPY daily chart
USD/JPY is trading off the monthly highs as the market is above the 50-day simple moving average (DSMA).
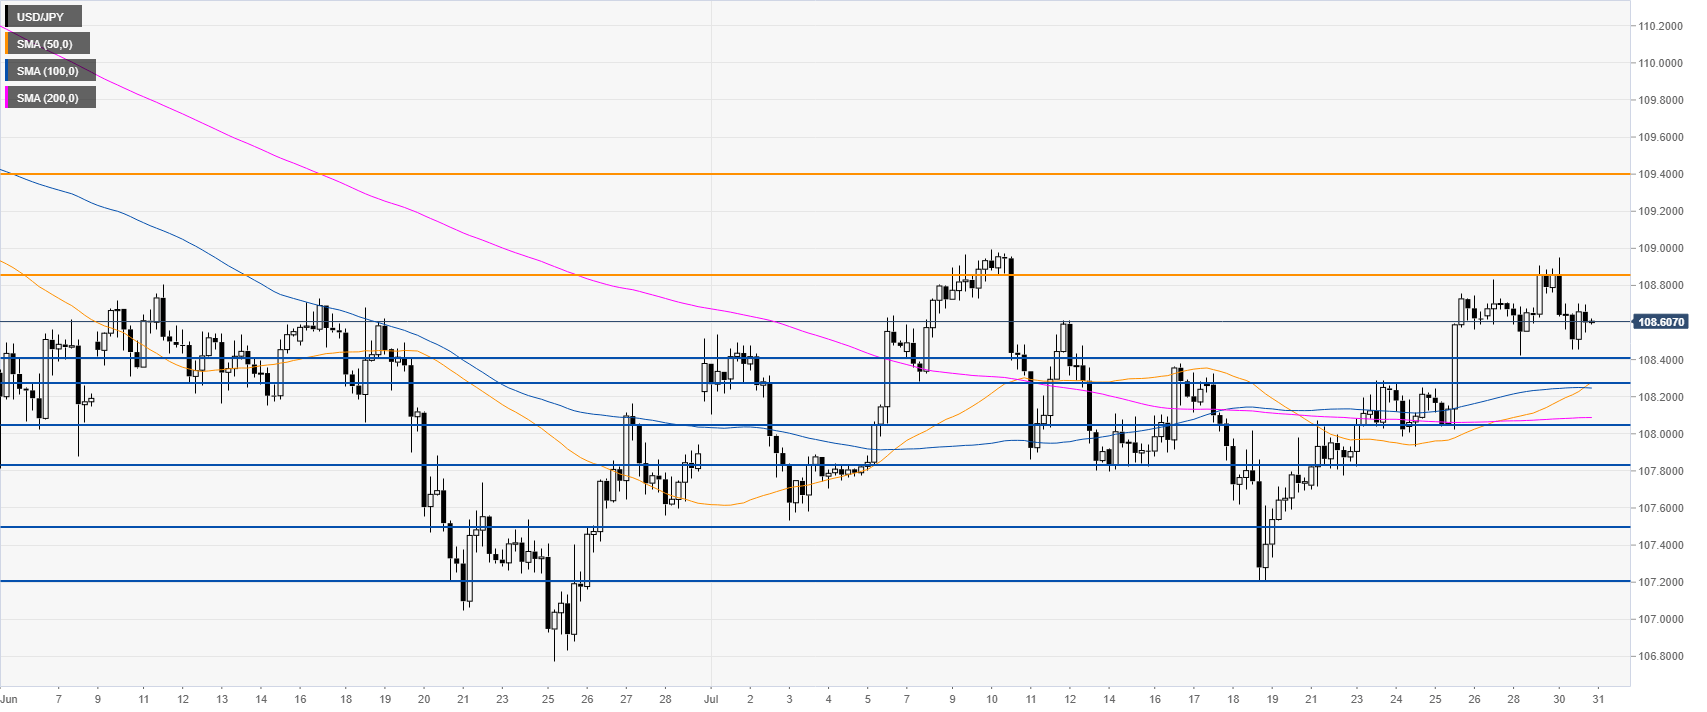
USD/JPY 4-hour chart
USD/JPY is trading above its main SMAs, suggesting bullish momentum in the medium term. However, bulls need a breakout above 108.50 to reach 109.40 resistance to the upside, according to the Technical Confluences Indicator.
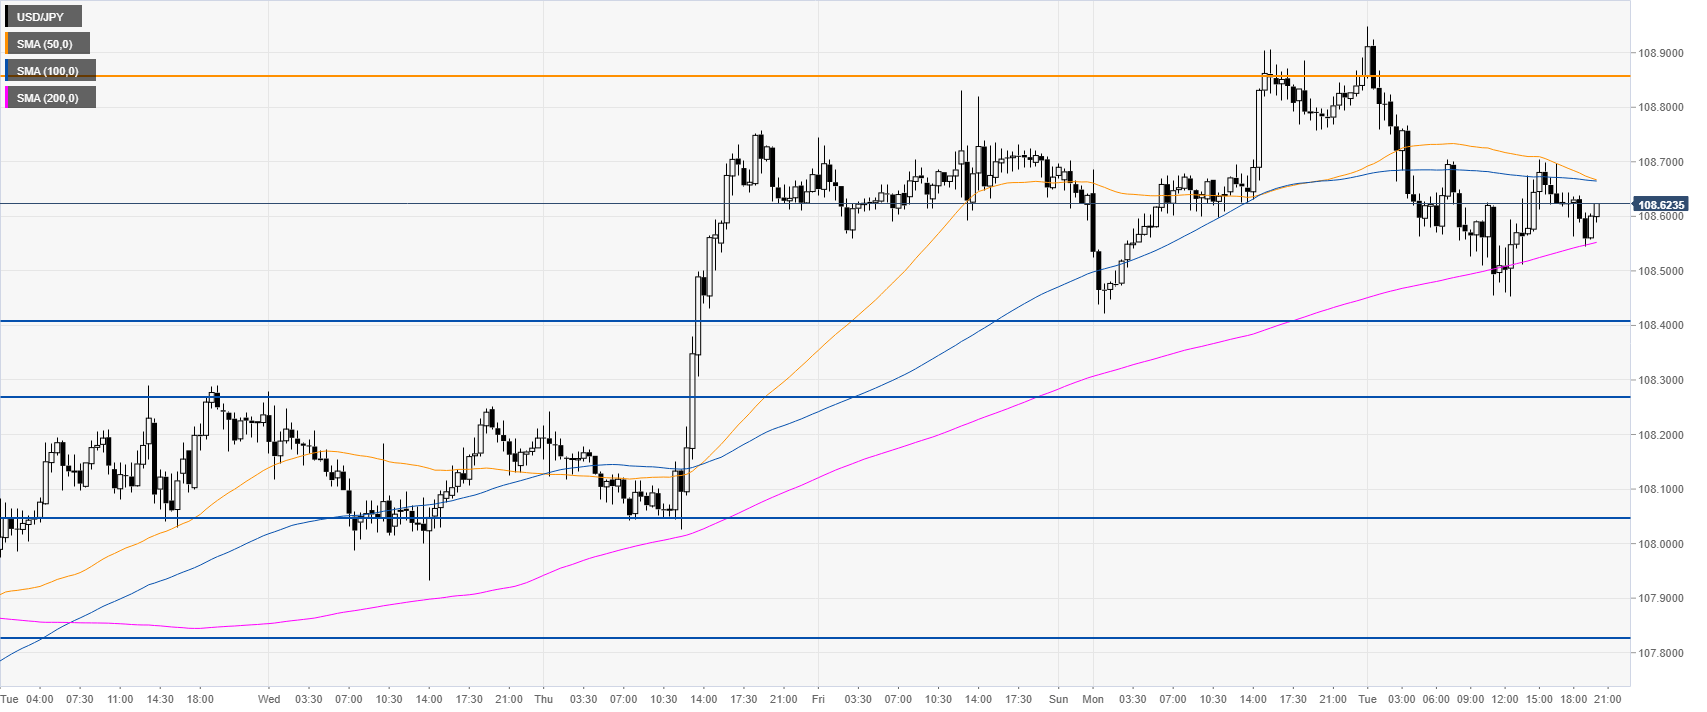
USD/JPY 30-minute chart
USD/JPY is trending below the 50 and 100 SMAs, suggesting a potential correction down in the near term. The market could declines towards 108.41 and the 108.03 support levels, according to the Technical Confluences Indicator.
Additional key levels
