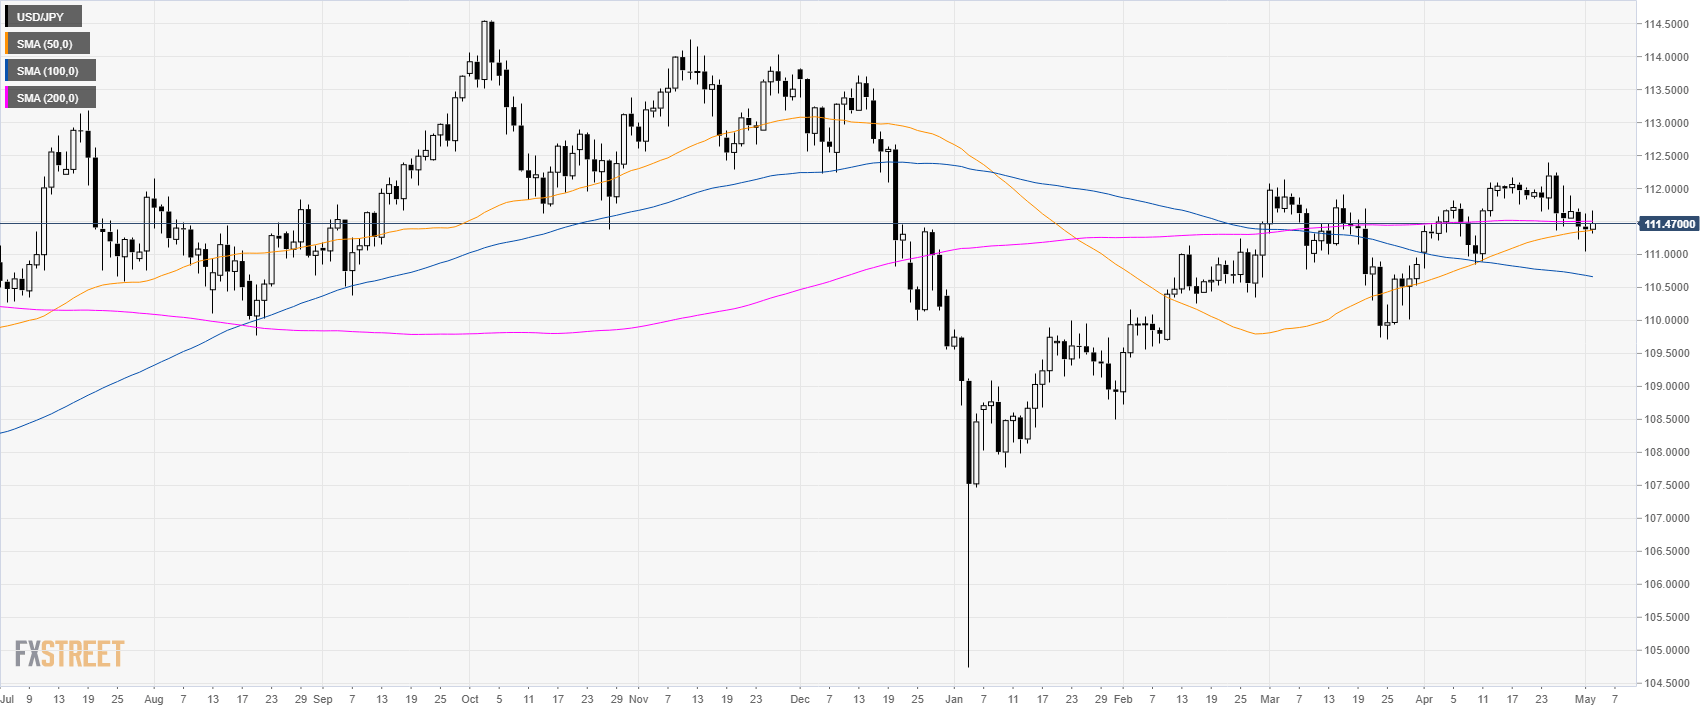
USD/JPY daily chart
- USD/JPY is trading near 111.50 close to a flat 200 SMA suggesting a sideways market.
- The US nonfarm payrolls this Friday can provide high volatility in USD-related pairs.
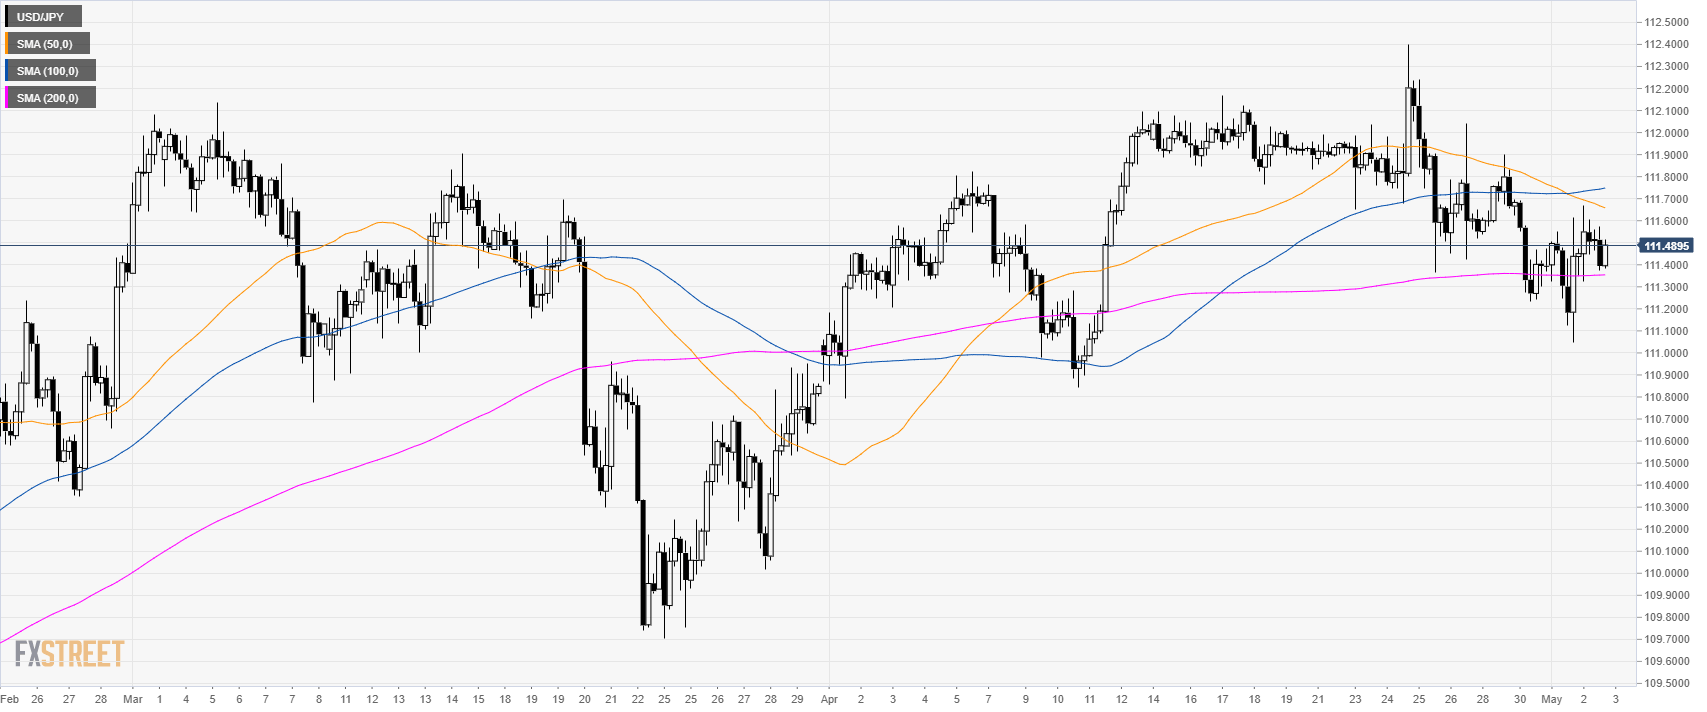
USD/JPY 4-hour chart
- USD/JPY is consolidating above the 200 SMA.
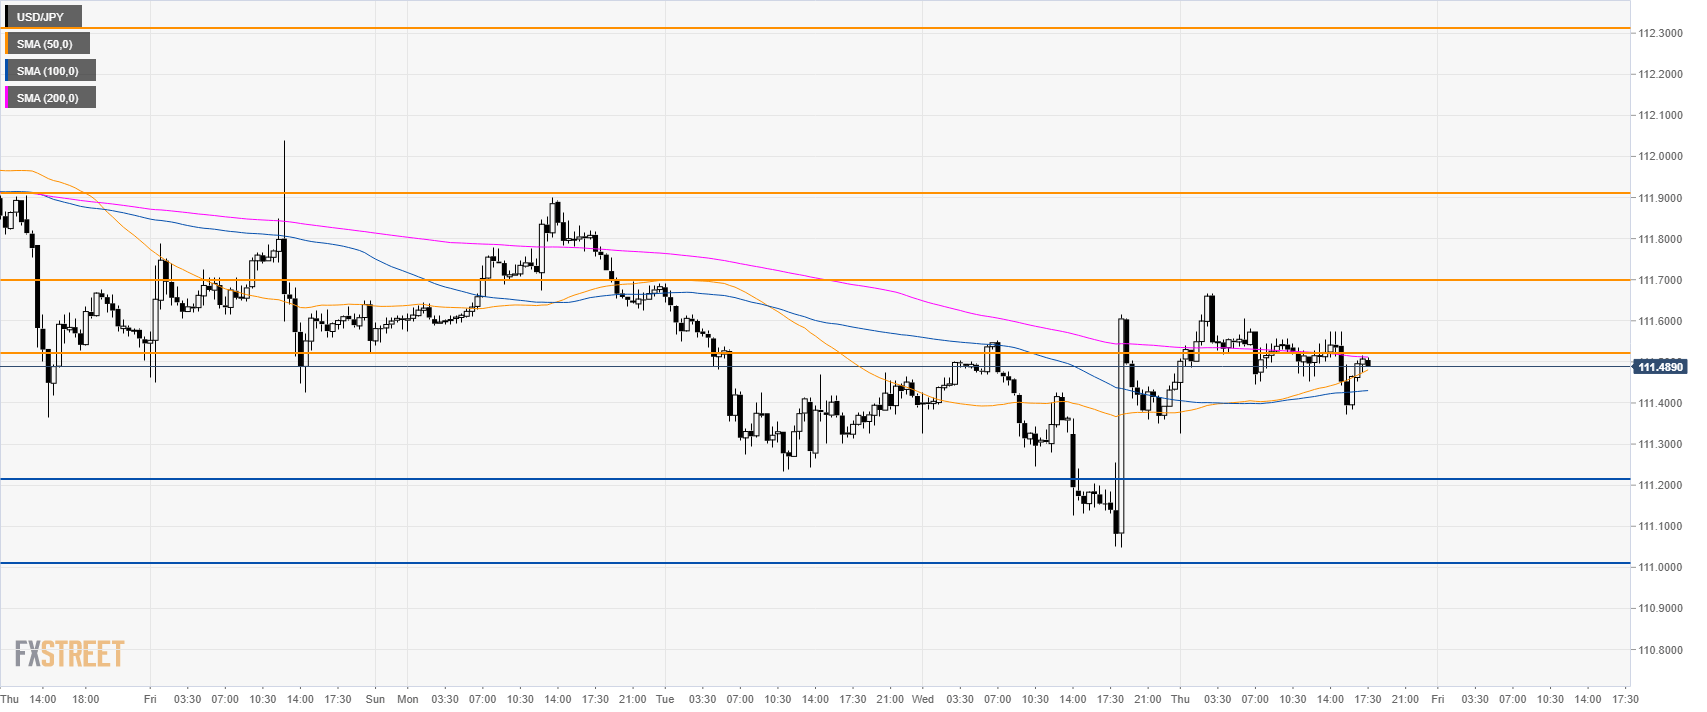
USD/JPY 30-minute chart
- USD/JPY is trading above its 50 and 100 SMA while the market is challenging 111.50 and the 200 SMA.
- USD bulls seem to be back and they will need to overcome 111.50 to travel to 111.70, 111.90 and to 112.30 if they gather enough steam.
- Support is at 111.20 and 111.00 figure.
Additional key levels
