- China is ready to do a deal on parts of negotiations both sides agree upon.
- USD/JPY broke above the 107.00 handle on the news, which saw the demand for safe-haven Yen go down.
- The level to beat for bulls is the 107.40 resistance.
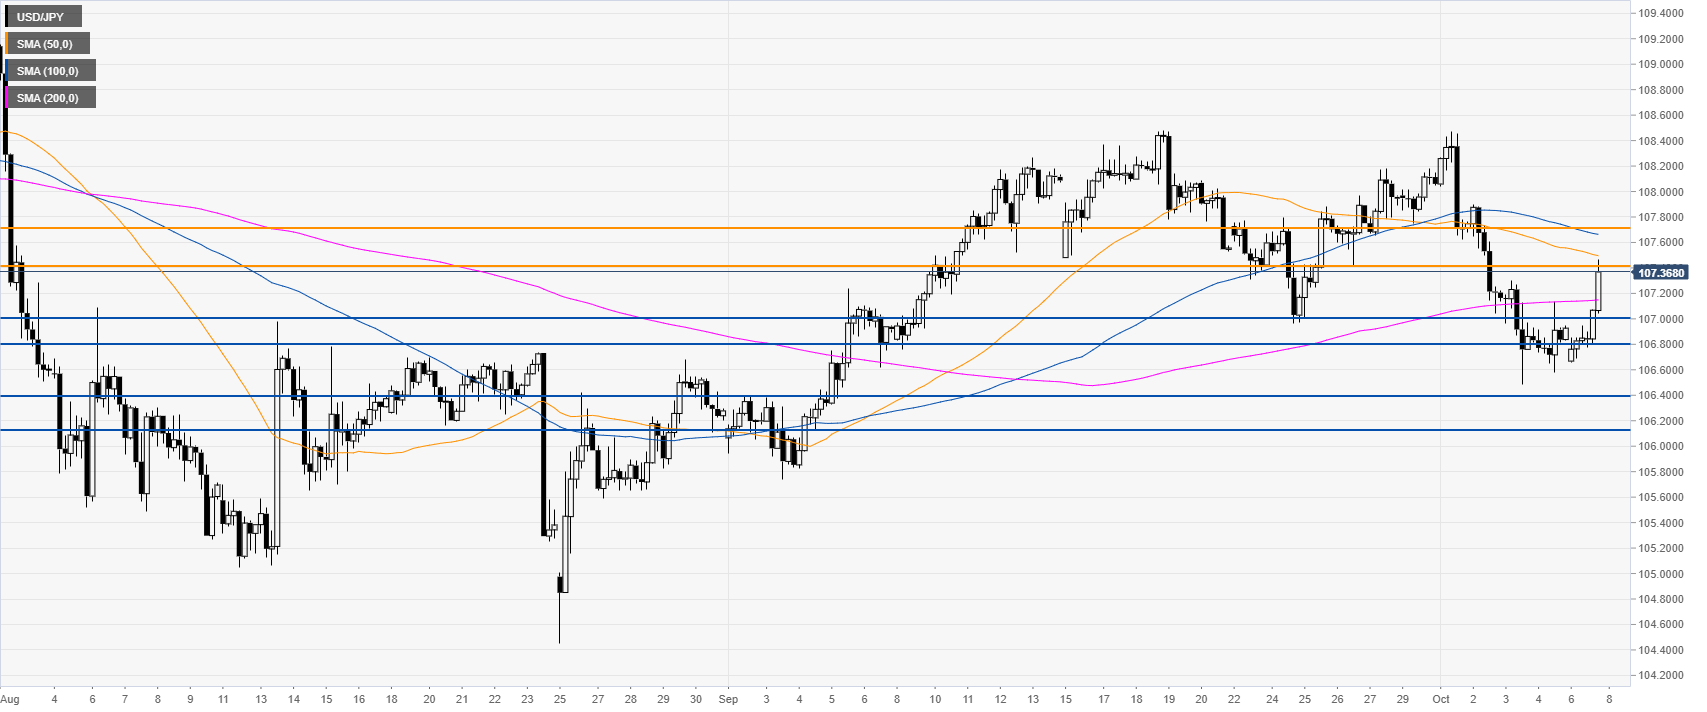
USD/JPY daily chart
USD/JPY is trading in a bear trend below the 100 and 200-day simple moving averages (DSMAs). The market found support near the 50 SMA.

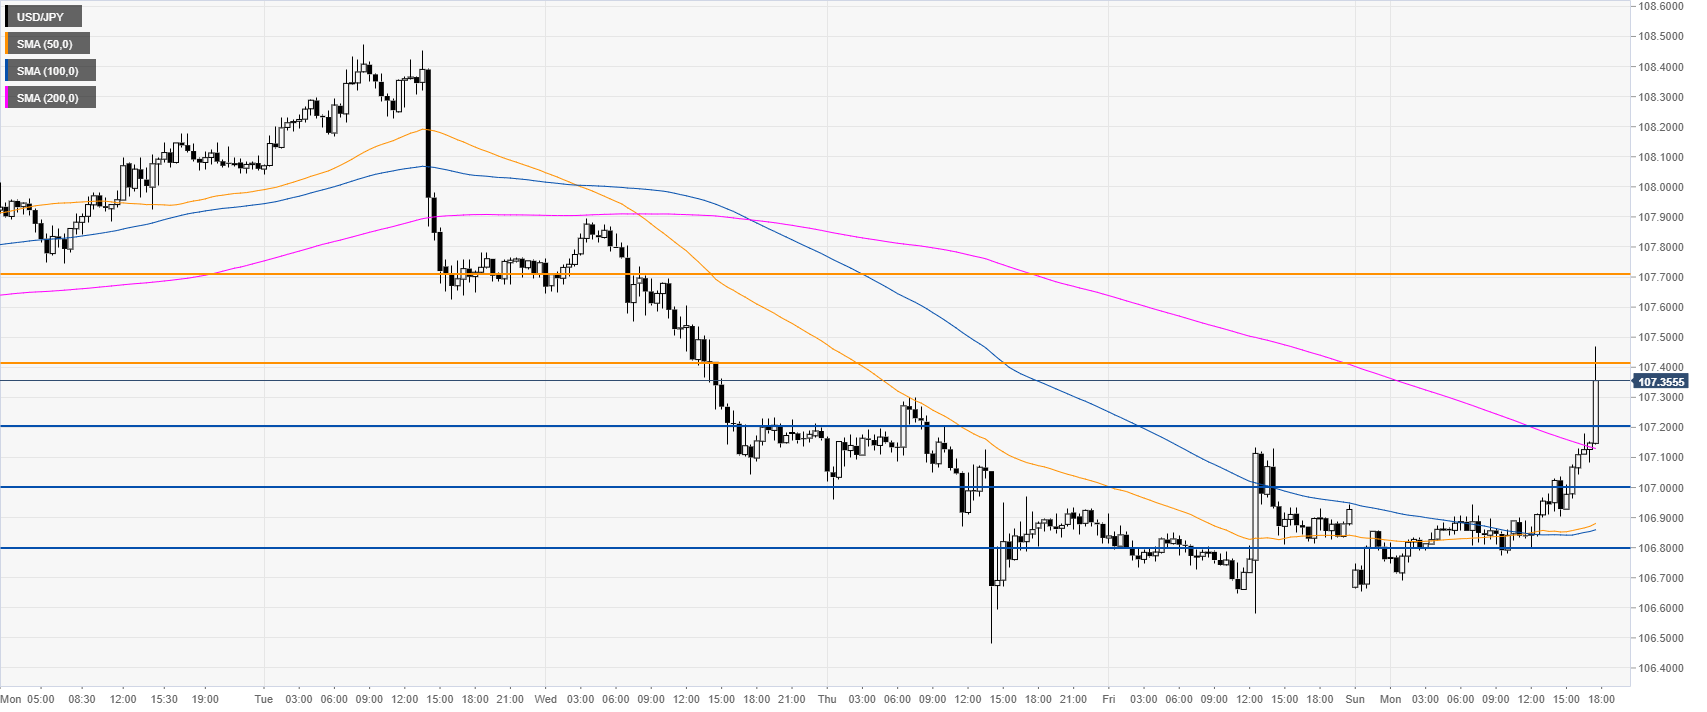
USD/JPY four-hour chart
USD/JPY is rebounding from the October lows and is now challenging the 107.40 resistance near the 50 SMA. A break above this level should lead to the 107.70 resistance, according to the Technical Confluences Indicator.
USD/JPY 30-minute chart
The USD/JPY currency pair is trading above the main SMAs, suggesting bullish momentum in the near term. Immediate supports are seen at the 107.20 and 107.00 price levels, according to the Technical Confluences Indicator.
Additional key levels
