- The Brexit optimism is lessening the demand for the safe-haven Yen.
- USD/JPY hits 108.88, a price which has not been seen since early August.
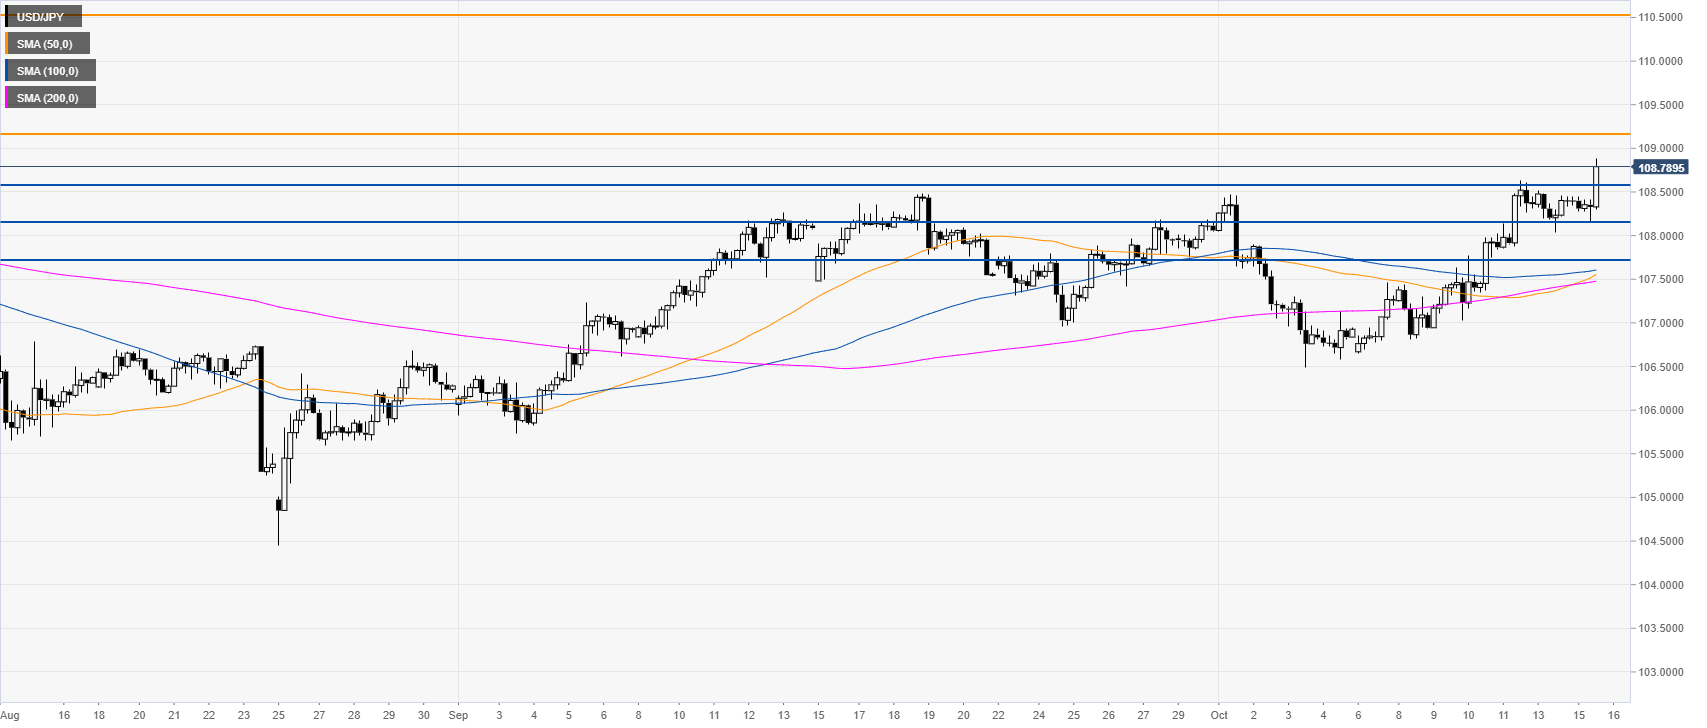
USD/JPY daily chart
The USD/JPY currency pair is trading in a bear trend below the 200-day simple moving average (DSMA). However, the market has been reversing sharply from the October lows and is now trading near two-months highs. Reports of a draft Brexit deal is boosting the market mood and lessening the demand for the safe-haven Yen.

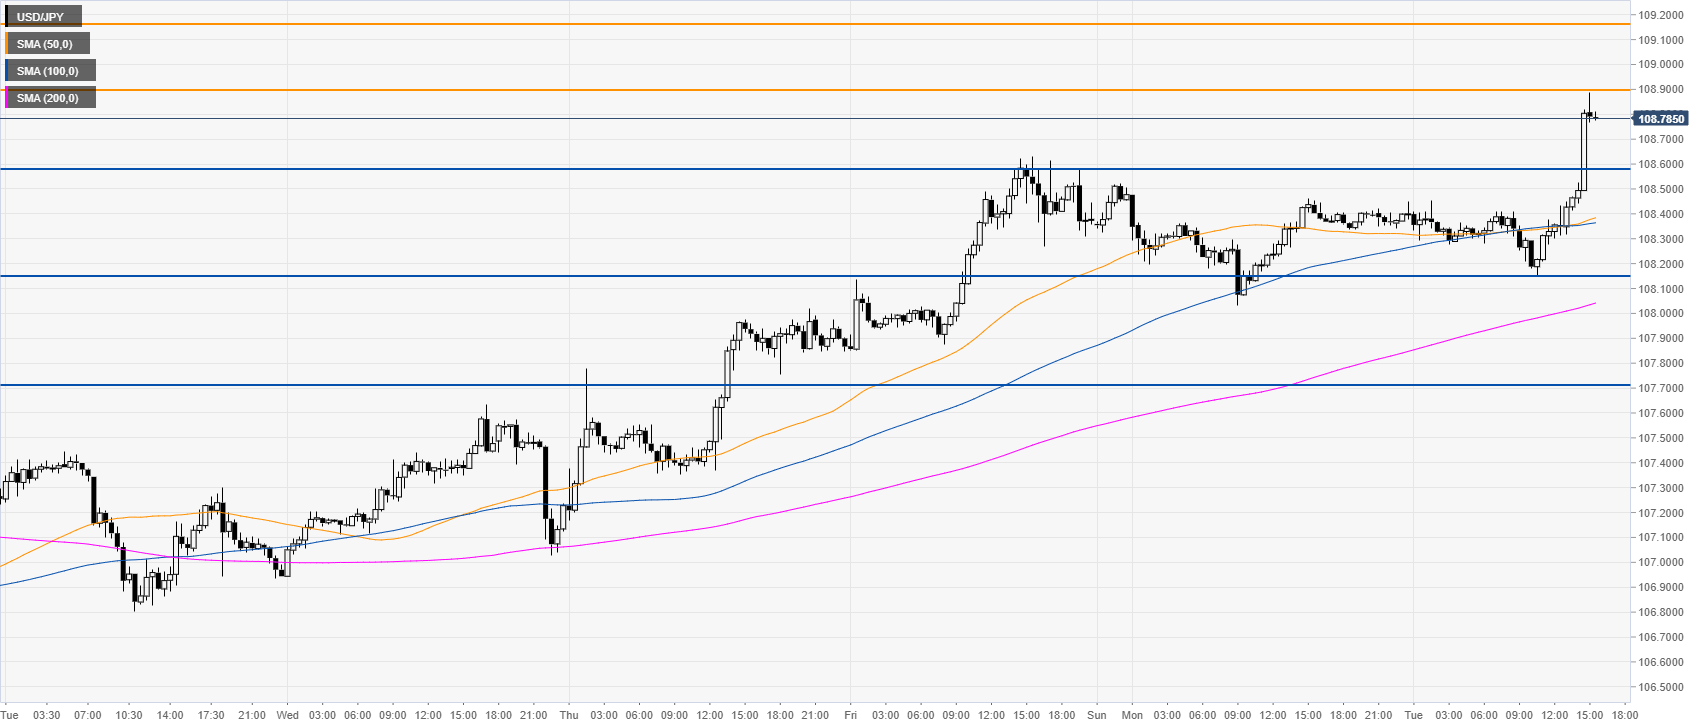
USD/JPY four-hour chart
USD/JPY is trading above the main SMAs on the four-hour chart, suggesting bullish momentum in the medium term. The market broke above the 108.56 resistance. A daily close above the resistance could open the doors to the 109.18 price level, according to the Technical Confluences Indicator.
USD/JPY 30-minute chart
USD/JPY is trading above its main SMAs, suggesting bullish momentum in the near term. Immediate supports are seen at the 108.56 and 108.16 price levels, according to the Technical Confluences Indicator.
Additional key levels
