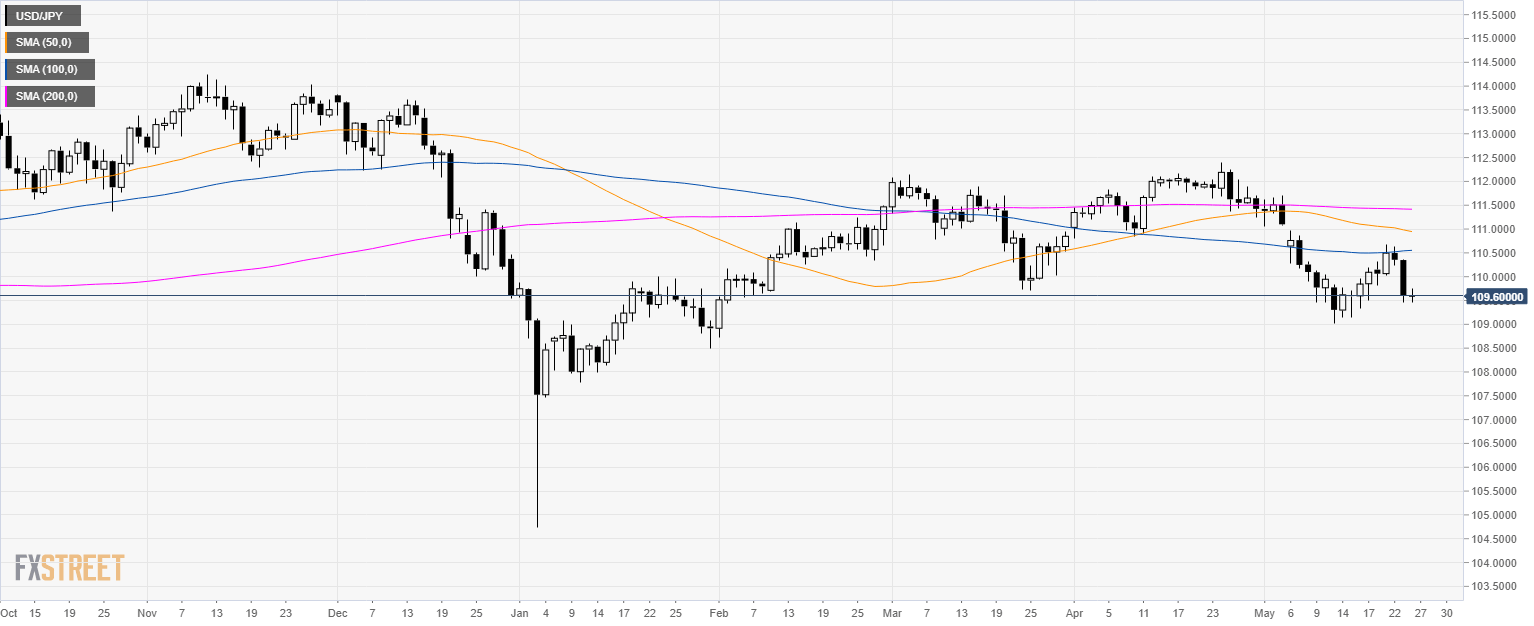
USD/JPY daily chart
USD/JPY is consolidating the losses seen this Thursday as the greenback is on the back foot across the board.
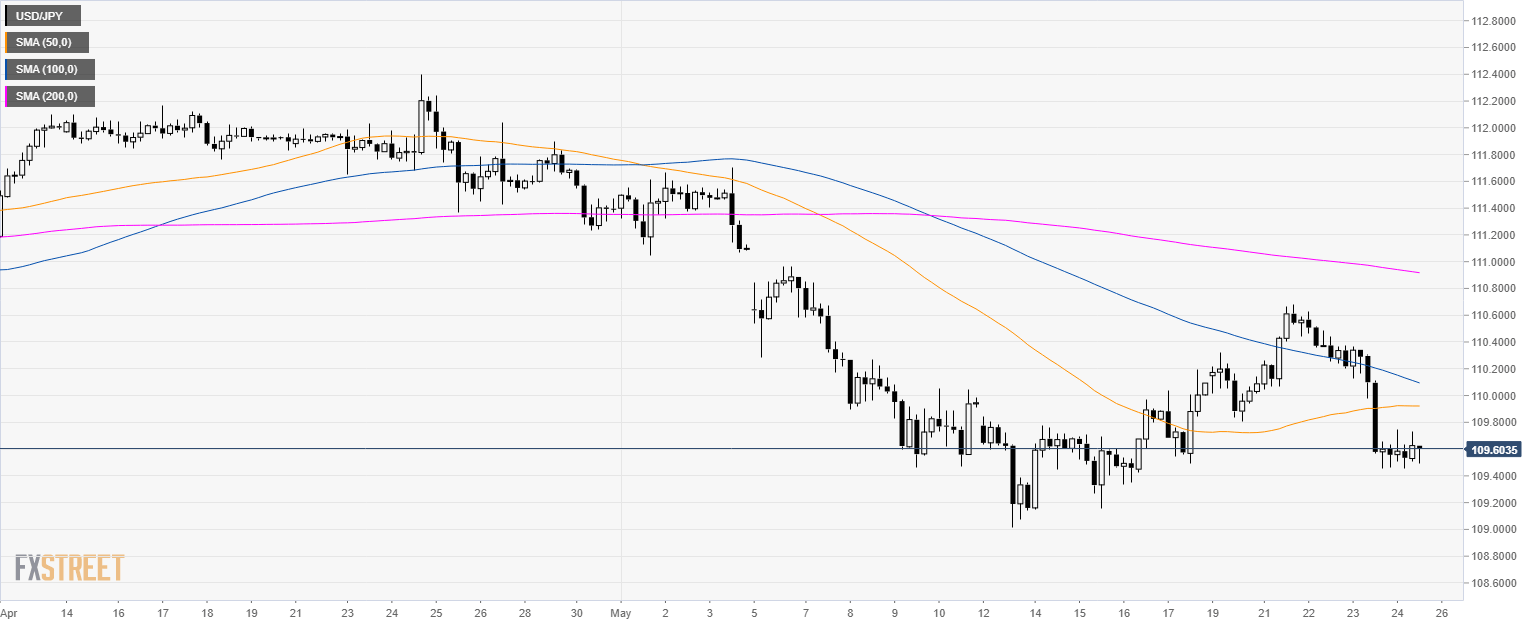
USD/JPY 4-hour chart
USD/JPY is trading below its main simple moving averages (SMAs).
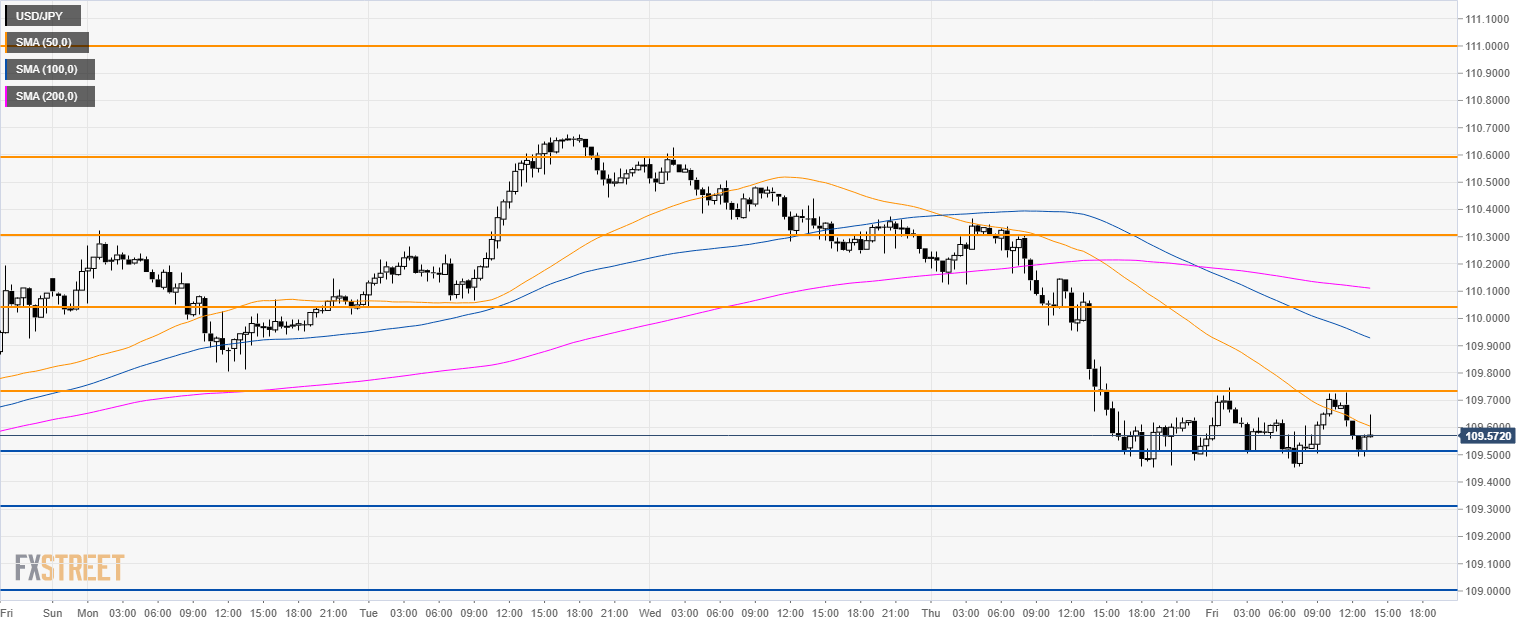
USD/JPY 30-minute chart
The market is in a tight range and it can essentially break in either direction. Bulls want to break above 109.75 to reach 110.05 level and 110.30 while bears need to overcome 109.50 support to travel south towards 109.30 and 109.00 the figure.
Additional key levels
