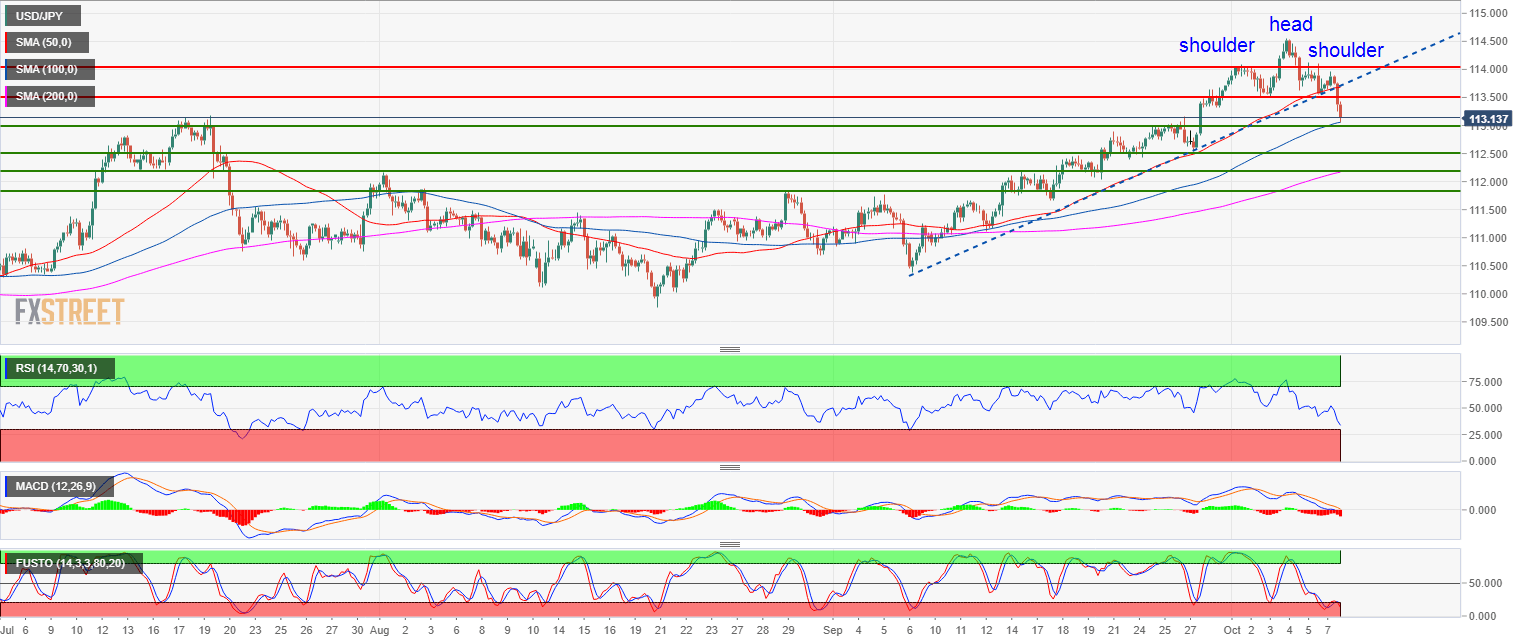
- USD/JPY bull trend is having a pullback as the market formed a bearish head-and-shoulders pattern.
- USD/JPY is currently finding some support near 113.18 (July high) and the market might consolidate the recent losses up to 113.55 (October 2 low). USD/JPY broke below the 50-period simple moving average and the bullish trendline suggesting a bearish bias.
- A break below 113.18 can open the gates to a bear continuation move to 112.55 (September 27 low) and 112.00 figure.
Spot rate: 113.18
Relative change: -0.47%
High: 113.96
Low: 113.05
Main trend: Bullish
Short-term trend: Bearish
Resistance 1: 113.55 October 2 low
Resistance 2: 114.00 figure
Resistance 3: 114.80 November 2017 high
Resistance 4: 115.50 March 10, 2017 high
Support 1: 113.18, July high
Support 2: 112.55 September 27 low
Support 3: 112.00-112.17 zone, figure and August 1 swing high
Support 4: 111.84 August 29 swing high
