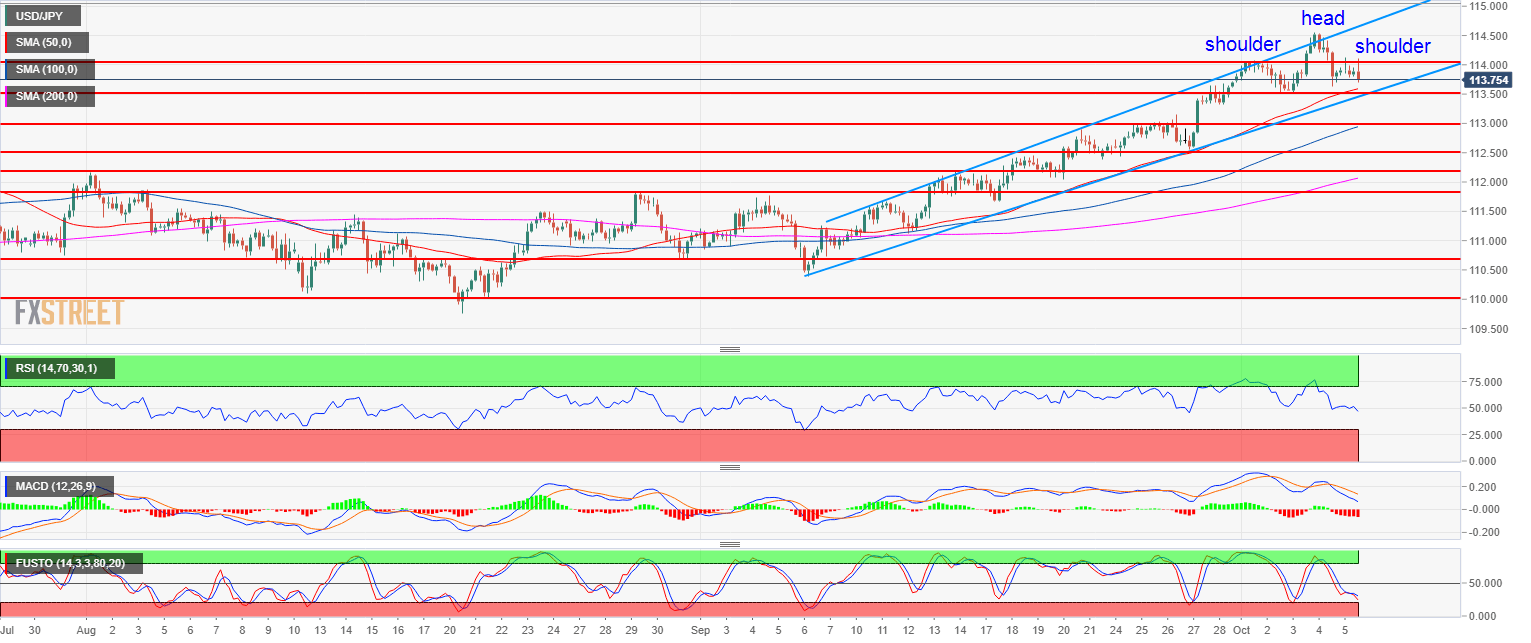
- USD/JPY is in a strong bull trend as it is trading above its 50, 100 and 200-period simple moving average.
- USD/JPY might be set for a corrective move down as a head-and-shoulders pattern is in the making. The RSI, MACD and Stochastics indicators are also losing steam.
- The current context suggests that a pullback down to 113.55 (October 2 low) and possibly to 113.18 can be next.
Spot rate: 113.71
Relative change: -0.17%
High: 114.12
Low: 113.68
Main trend: Bullish
Resistance 1: 114.00 figure
Resistance 2: 114.80 November 2017 high
Resistance 3: 115.50 March 10, 2017 high
Support 1: 113.55 October 2 low
Support 2: 113.18, July high
Support 3: 112.50 figure
Support 4: 112.00-112.17 zone, figure and August 1 swing high
Support 5: 111.84 August 29 swing high
