- The previous twenty-four hours saw the USD/JPY bumping into the high side of consolidation in Friday’s trading range, clipping into resistance 123.60 but remaining constrained as swinging market sentiment continues to play tug-of-war with risk flows.
- Monday’s early action sees the Dollar-Yen pairing testing 112.50 as volume-thinned markets test the waters in the new trading week.
- USD/JPY analysis: unconvinced bulls at risk of giving up
USD/JPY, M5
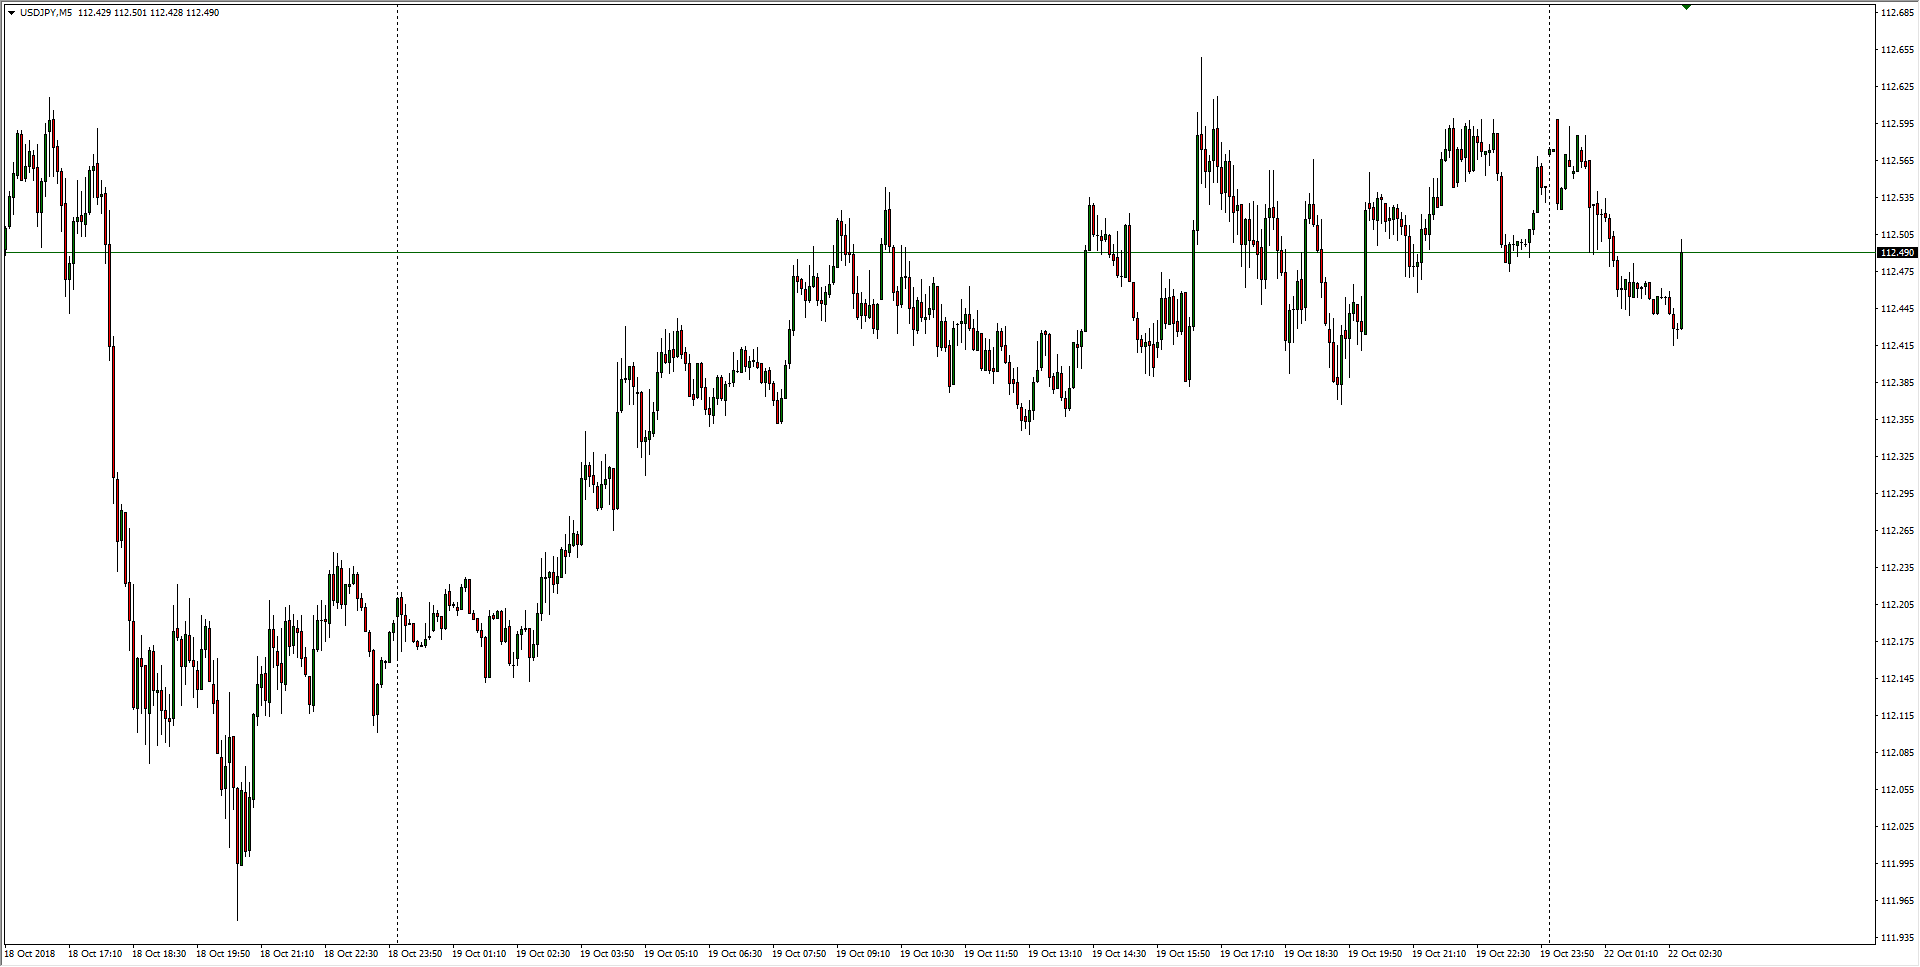
- The last week saw the USD/JPY trying to mount recent near-term resistance from 112.60 to 112.70, and a constraining pattern is beginning to form up from last week’s peaks and lows.
USD/JPY, M30
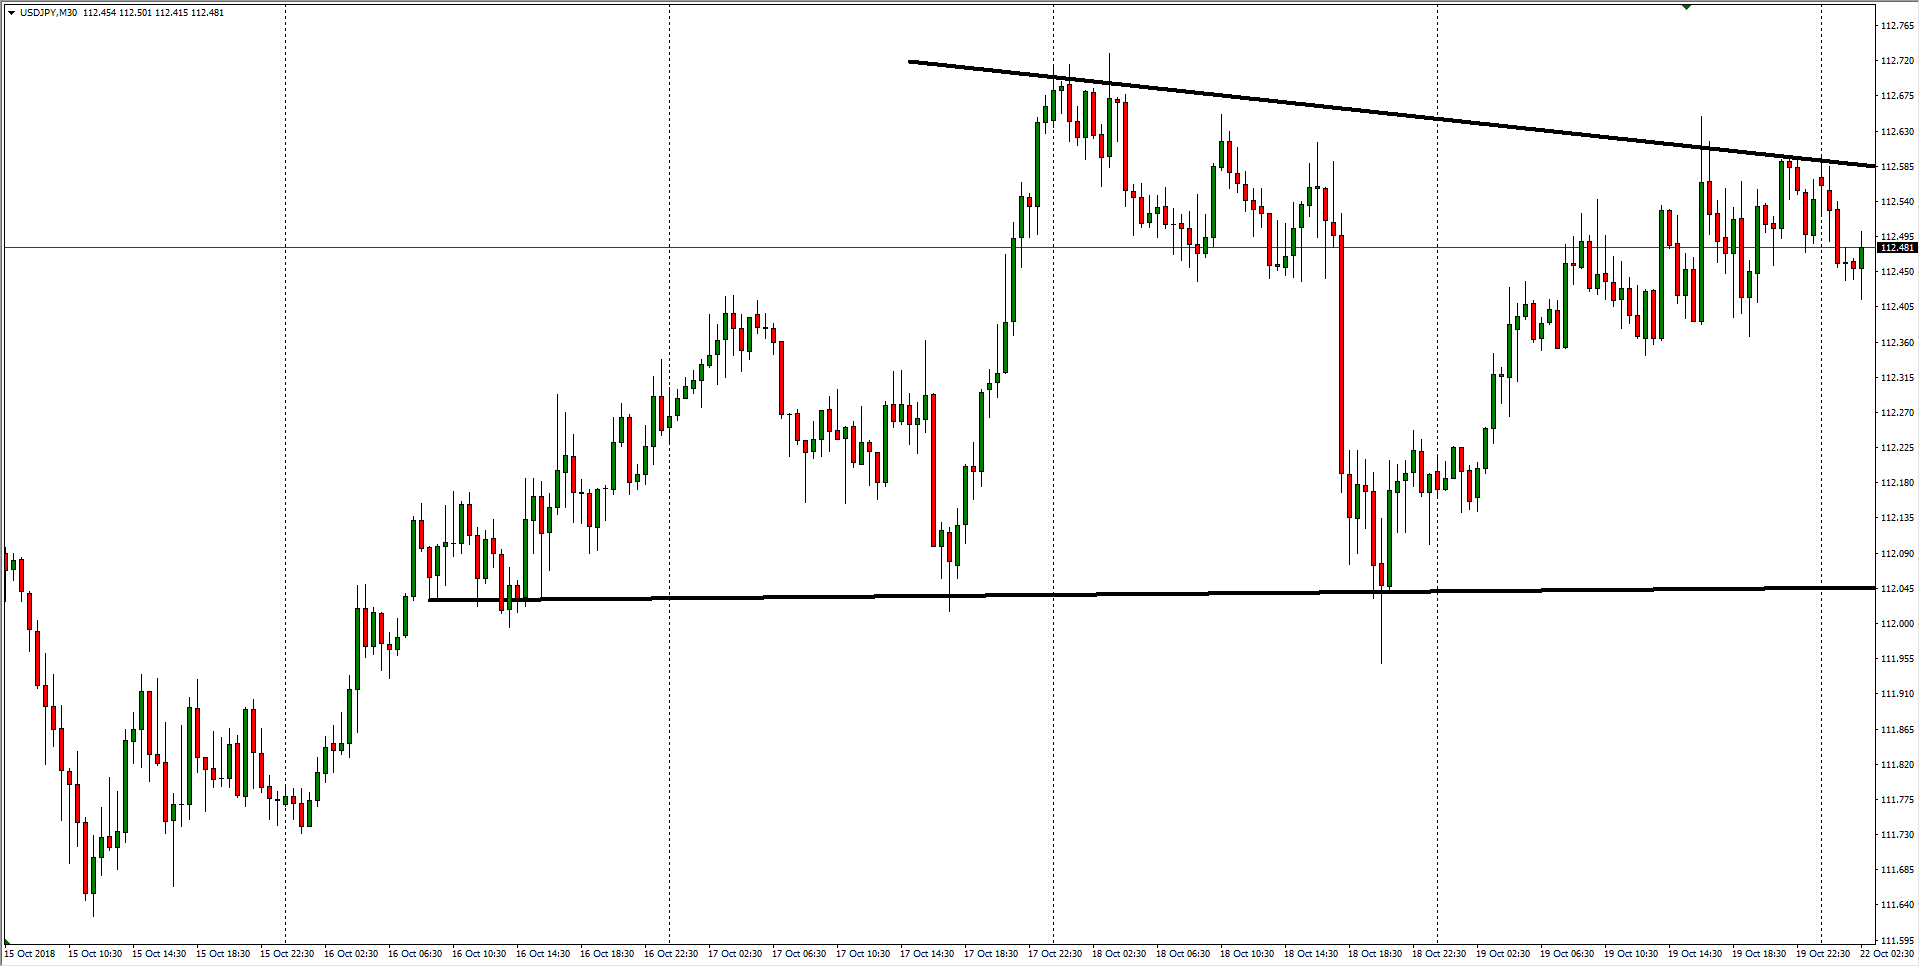
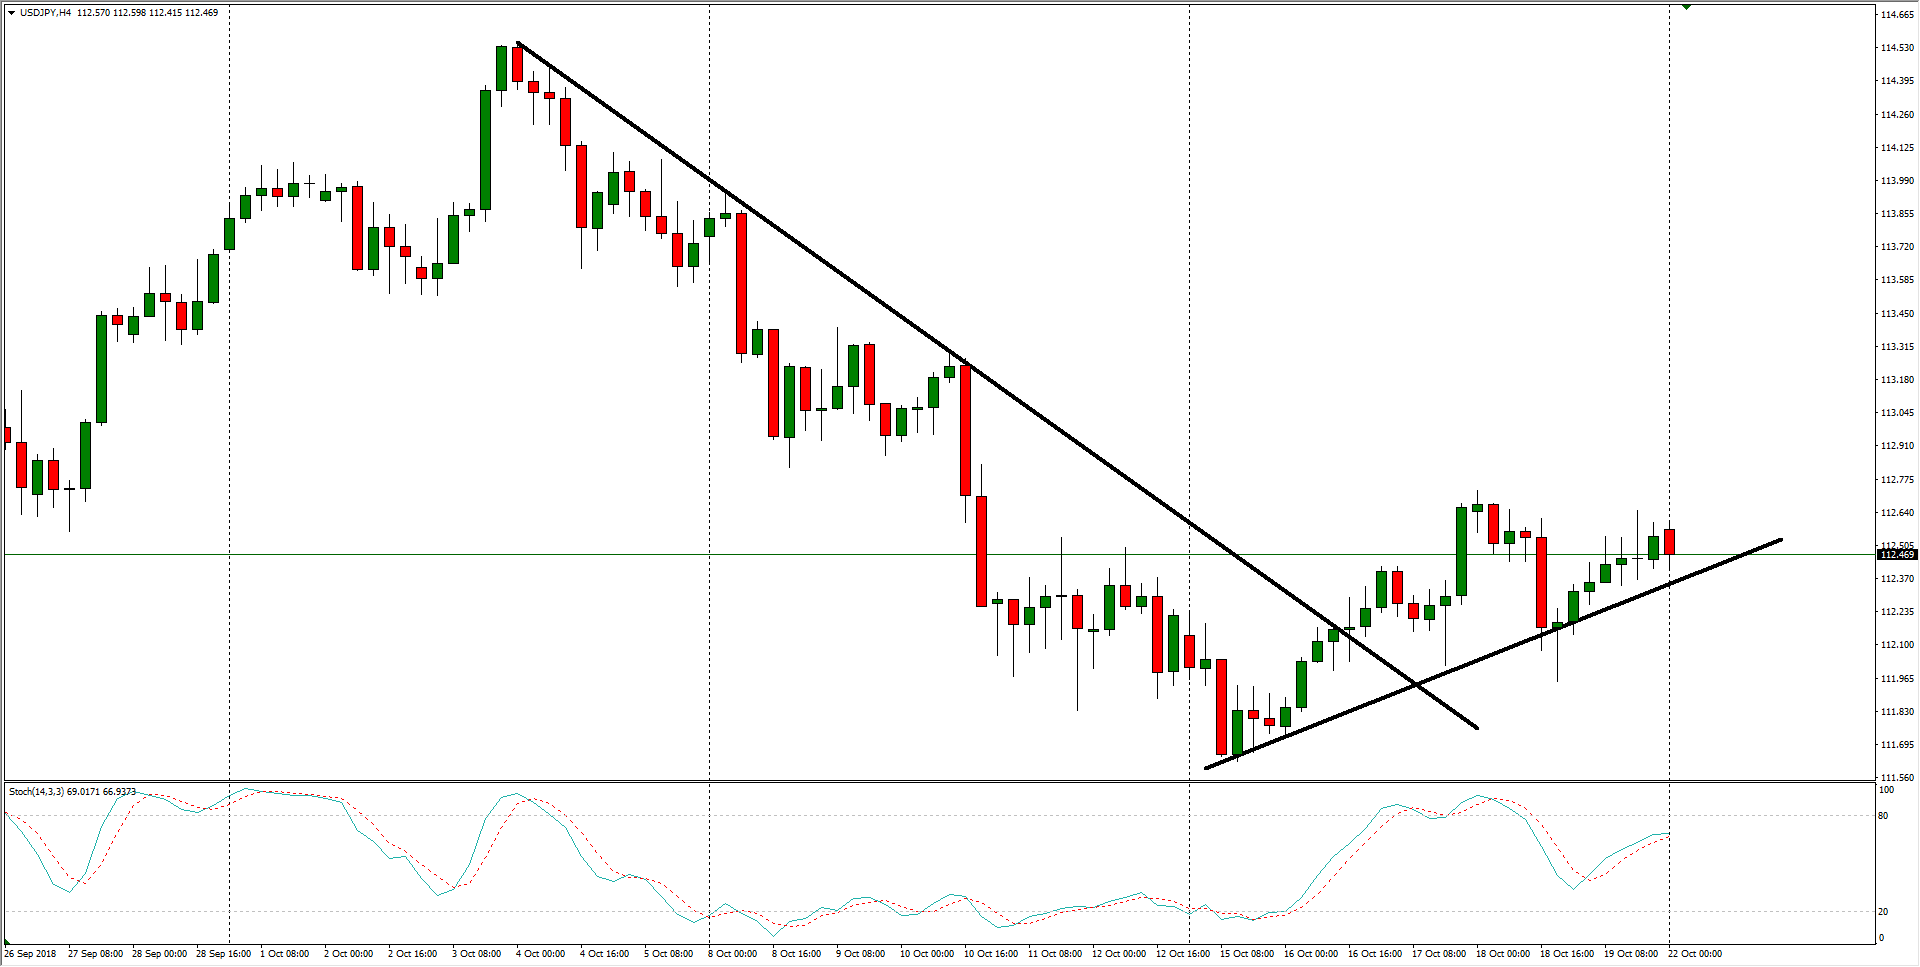
- In the medium-term, the last four weeks have seen the Greenback manage to break a declining trendline, and mounting a higher low from the 112.00 handle has the USD/JPY on pace to begin a bullish correction, but buyers will first have to break through last week’s resistance built into 112.70.
USD/JPY, H4
Don’t forget to check out FXStreet’s Livechart to see what’s happening with the USD/JPY
USD/JPY
Overview:
Last Price: 112.43
Daily change: -12 pips
Daily change: -0.107%
Daily Open: 112.55
Trends:
Daily SMA20: 112.98
Daily SMA50: 111.97
Daily SMA100: 111.45
Daily SMA200: 109.83
Levels:
Daily High: 112.66
Daily Low: 112.14
Weekly High: 112.75
Weekly Low: 111.62
Monthly High: 113.71
Monthly Low: 110.38
Daily Fibonacci 38.2%: 112.46
Daily Fibonacci 61.8%: 112.34
Daily Pivot Point S1: 112.24
Daily Pivot Point S2: 111.92
Daily Pivot Point S3: 111.71
Daily Pivot Point R1: 112.76
Daily Pivot Point R2: 112.97
Daily Pivot Point R3: 113.29
