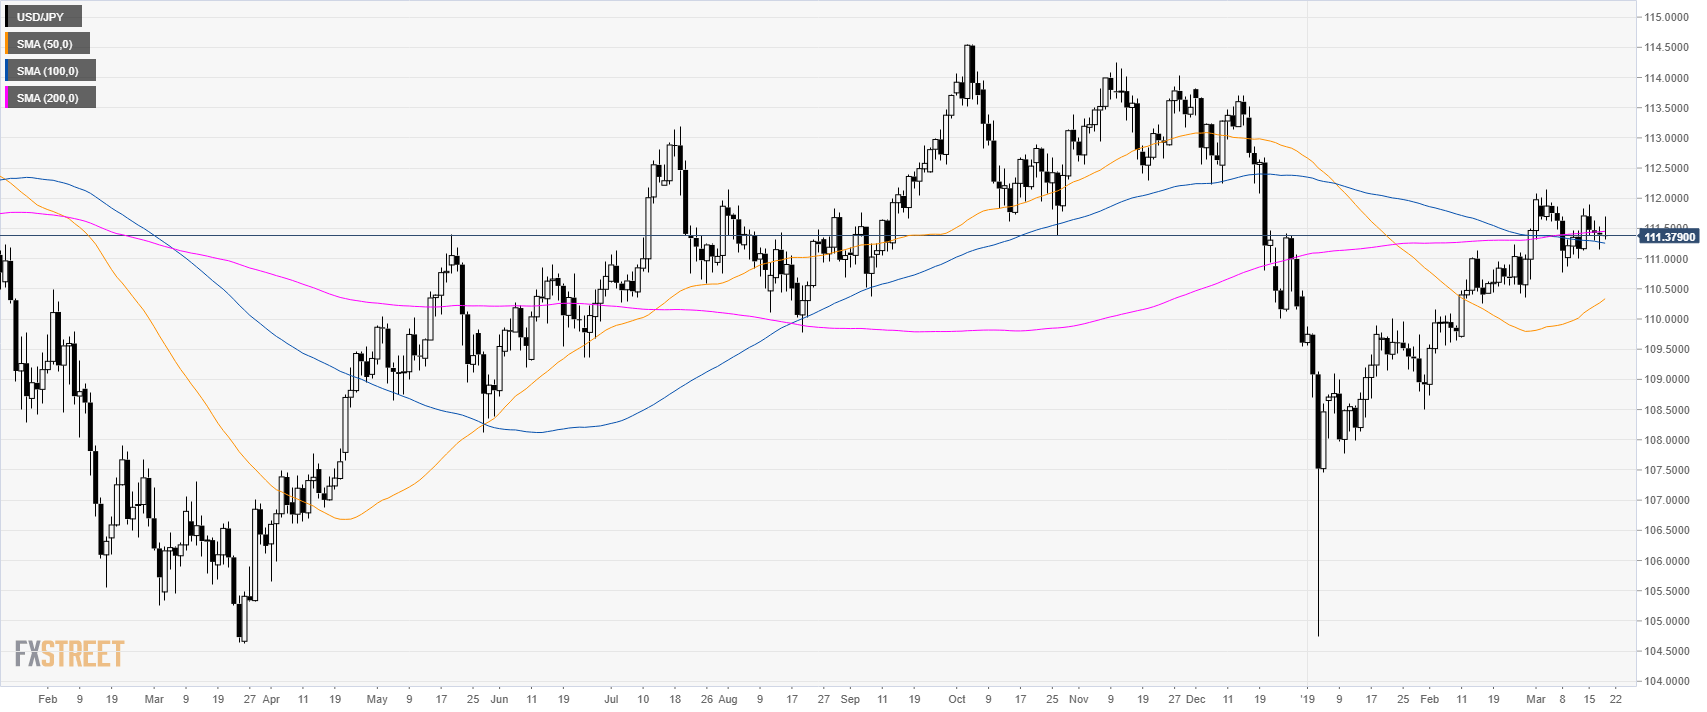
Home USD/JPY Technical Analysis: Losing steam below 111.50 ahead of Fed
FXStreet News

USD/JPY Technical Analysis: Losing steam below 111.50 ahead of Fed

USD/JPY daily chart

  • USD/JPY is in a consolidation between its 200-day simple moving average.
  • The FOMC at 18.00 GMT can lead to high volatility.

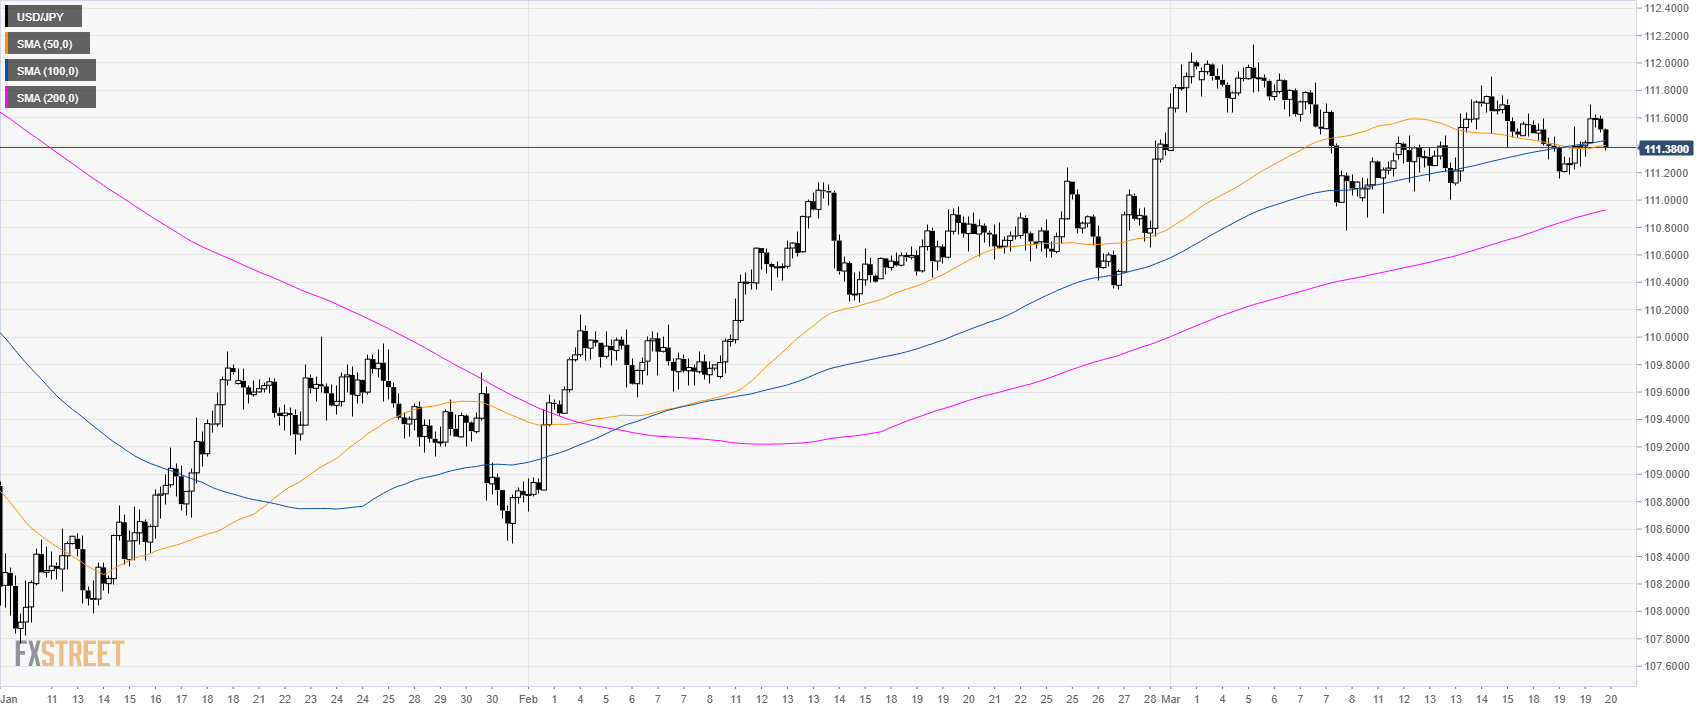
USD/JPY 4-hour chart

  • USD/JPY is consolidation between the 50 and 100 SMA.  

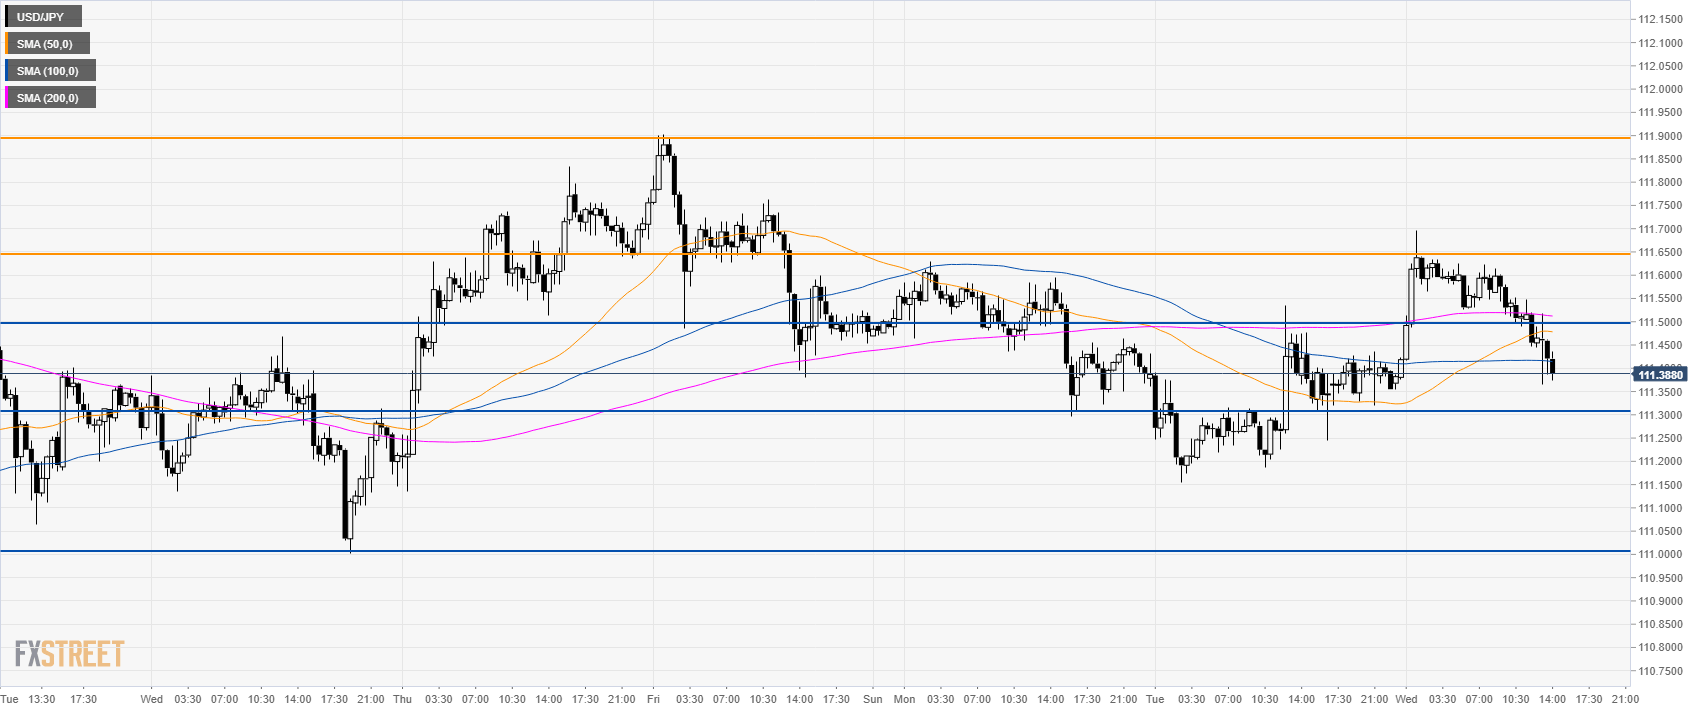
USD/JPY 30-minute chart

  • USD/JPY is trading below its main SMAs suggesting bearish momentum in the short-term.
  • A break below 111.30 can lead to 111.00 figure.
  • Resistances are at 111.50 and 111.65 level.
     

Additional key levels


FX Street

FX Street

FXStreet is the leading independent portal dedicated to the Foreign Exchange (Forex) market. It was launched in 2000 and the portal has always been proud of their unyielding commitment to provide objective and unbiased information, to enable their users to take better and more confident decisions.