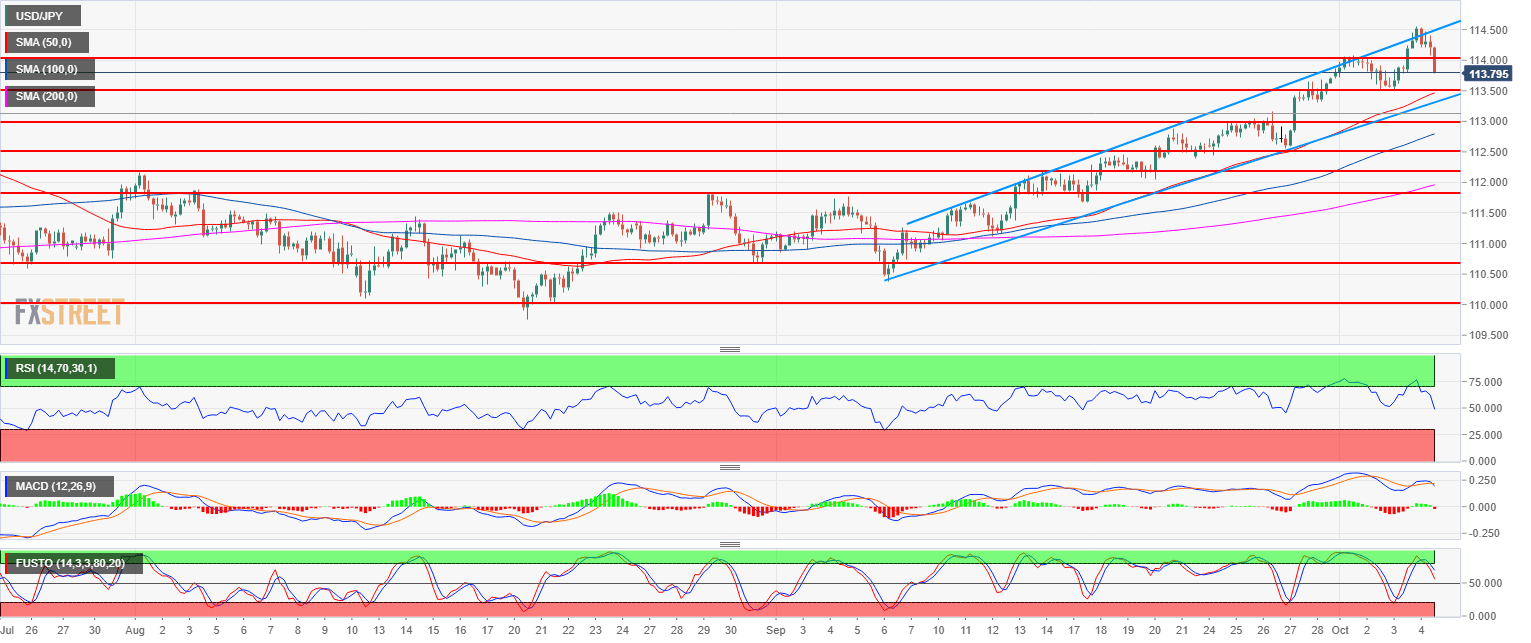
- USD/JPY is in a strong bull trend.
- USD/JPY is currently pulling back below the 114.00 figure while the RSI, MACD and Stochastics are turning lower. The correction can extend to 113.55 (October 2 low).
- The 50, 100 and 200-period simple moving averages are rising and widening suggesting a strong bullish bias.
USD/JPY 4-hour chart
USD/JPY
Overview:
Last Price: 113.91
Daily change: -63 pips
Daily change: -0.550%
Daily Open: 114.54
Trends:
Daily SMA20: 112.45
Daily SMA50: 111.64
Daily SMA100: 111.11
Daily SMA200: 109.83
Levels:
Daily High: 114.56
Daily Low: 113.52
Weekly High: 113.71
Weekly Low: 112.39
Monthly High: 113.71
Monthly Low: 110.38
Daily Fibonacci 38.2%: 114.16
Daily Fibonacci 61.8%: 113.91
Daily Pivot Point S1: 113.85
Daily Pivot Point S2: 113.16
Daily Pivot Point S3: 112.8
Daily Pivot Point R1: 114.89
Daily Pivot Point R2: 115.25
Daily Pivot Point R3: 115.94
Main trend: Bullish
Resistances and Supports:
Resistance 1: 114.00 figure
Resistance 2: 114.80 November 2017 high
Resistance 3: 115.50 March 10, 2017 high
Support 1: 113.55 October 2 low
Support 2: 113.18, July high
Support 3: 112.50 figure
Support 4: 112.00-112.17 zone, figure and August 1 swing high
Support 5: 111.84 August 29 swing high
