- USD/JPY is clinging to weekly highs near 108.75 level
- The level to beat for bulls is the 108.95 resistance.
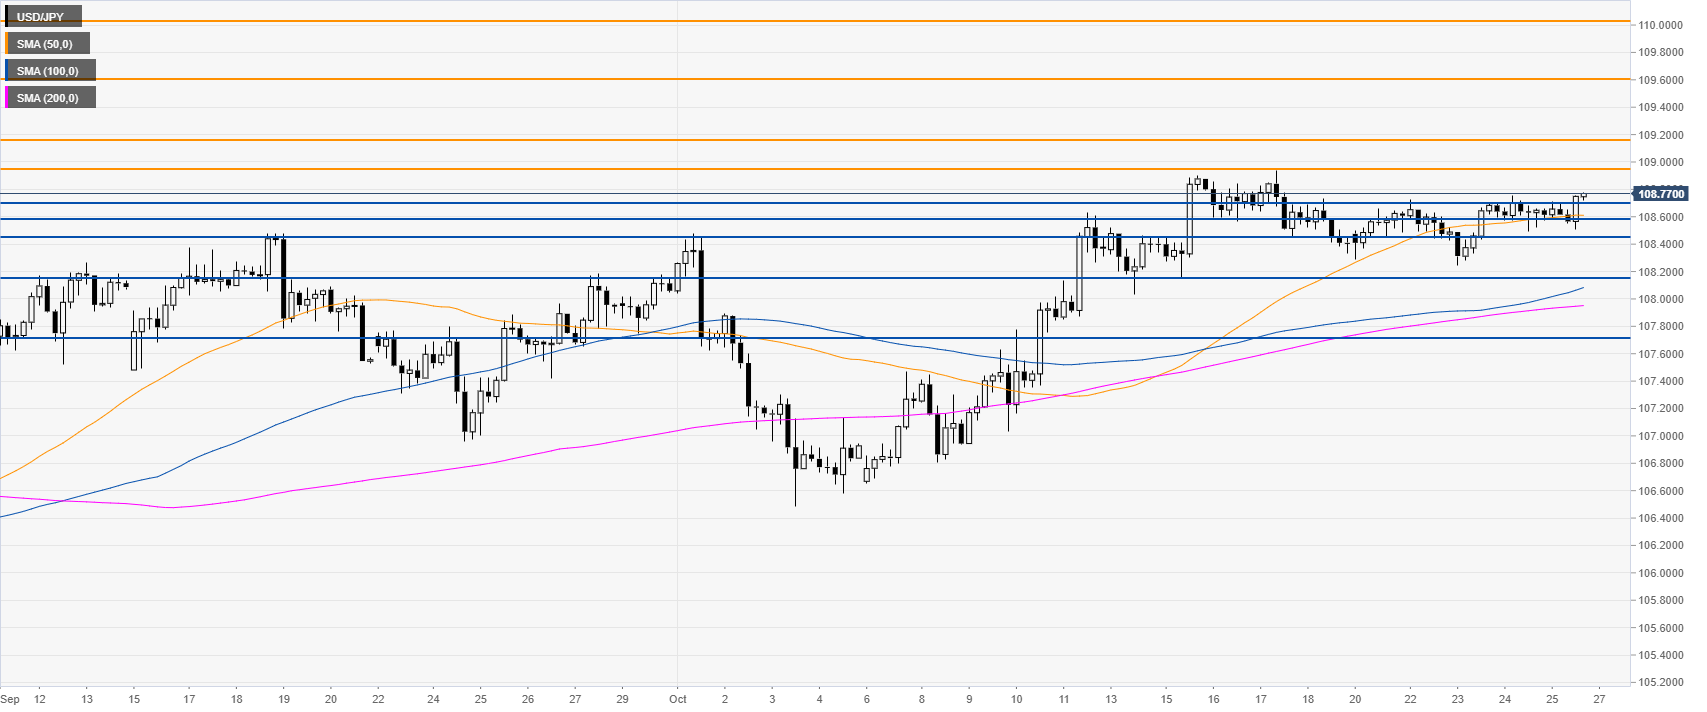
USD/JPY daily chart
USD/JPY is trading in a downtrend below its 200-day simple moving average (DMA). However, since August, the spot has been rebounding sharply.

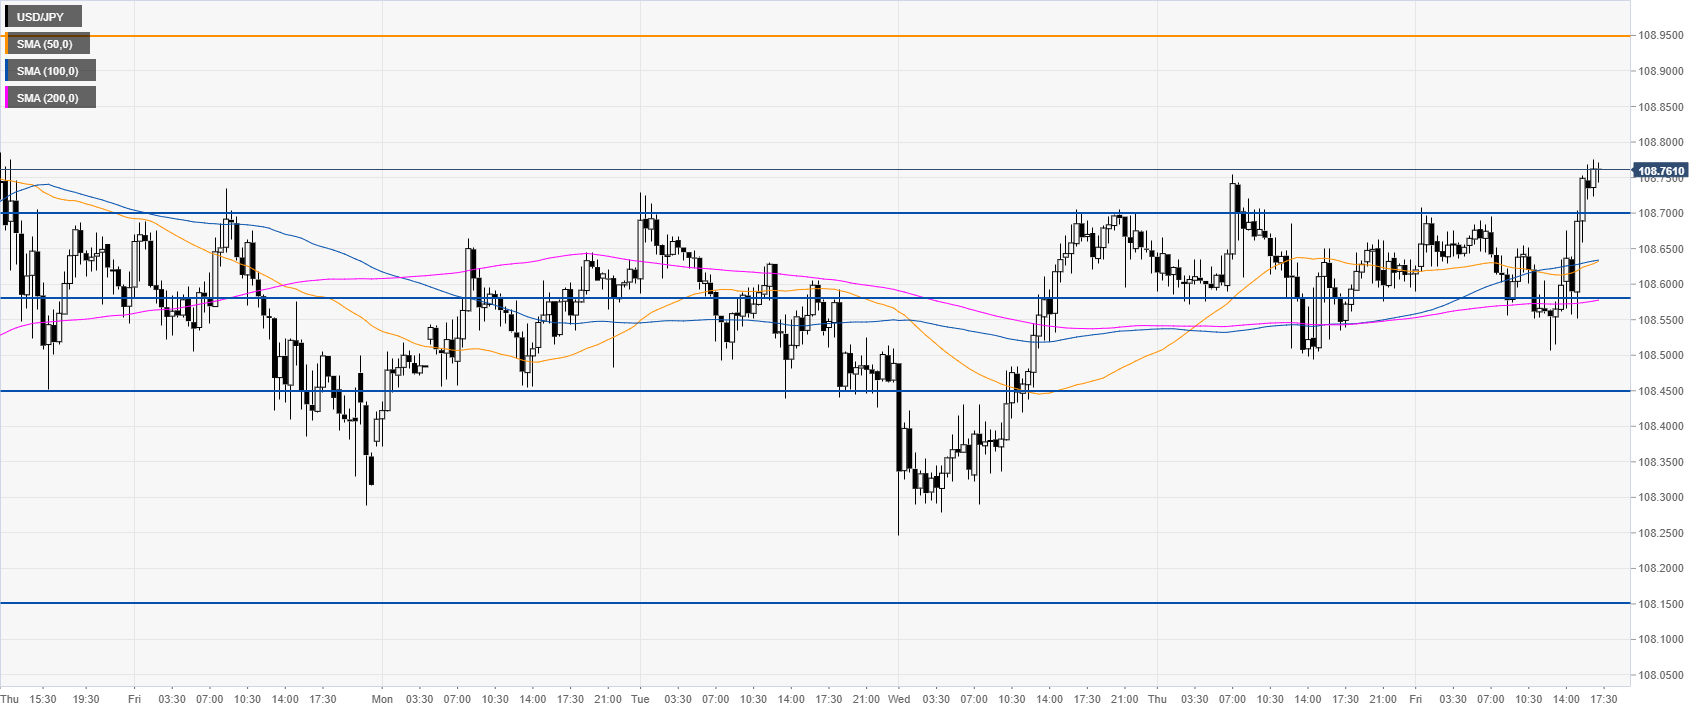
USD/JPY four-hour chart
USD/JPY is trading sideways above its main SMAs on the four-hour chart, suggesting a neutral to bullish bias in the medium term. Bulls need to overcome the 108.95 resistance to travel towards the 109.16, 109.60 and 110.00 price levels, according to the Technical Confluences Indicator.
USD/JPY 30-minute chart
USD/JPY is trading above its main SMAs, suggesting a bullish bias in the near term. Support is seen at the 108.70 and 108.85 levels, according to the Technical Confluences Indicator.
Additional key levels
