- USD/JPY is in a strong bull trend.
- USD/JPY is finding support near 113.65 (intraday swing high Sept. 28). The bullish bias remains intact as the 50, 100 and 200-period simple moving averages are rising and widening.
- The next targets to the upside are seen near 114.80 (November 2017 high) and 115.50 (March 10, 2017 high).
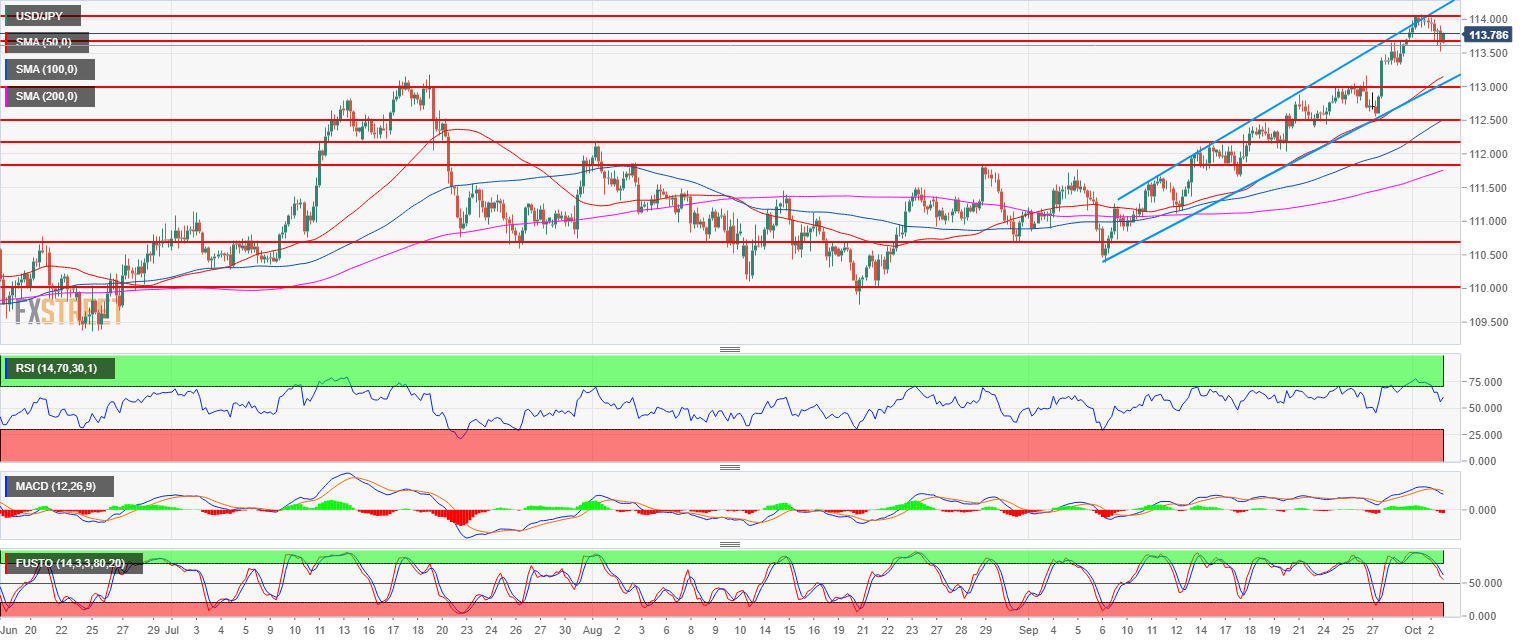
Spot rate: 113.80
Relative change: -0.12%
High: 114.03
Low: 113.52
Main trend: Bullish
Resistance 1: 114.00 figure
Resistance 2: 114.80 November 2017 high
Resistance 3: 115.50 March 10, 2017 high
Support 1: 113.65 intraday swing high Sept. 28
Support 2: 113.18, July high
Support 3: 112.50 figure
Support 4: 112.00-112.17 zone, figure and August 1 swing high
Support 5: 111.84 August 29 swing high
