- USD/JPY main bull trend is on hold since mid-July as the market has entered a trading range.
- USD/JPY bulls are trying to break above 111.84 resistance (August 29 swing high). However, the RSI and Stochastics have a relatively high reading which is rather bearish in a trading range context like this one. Therefore a return towards 111.00 figure is expected.
- Only a sustained bull breakout above 112.17 (August 1, swing high) would confirm a bullish condition.
USD/JPY 4-hour chart
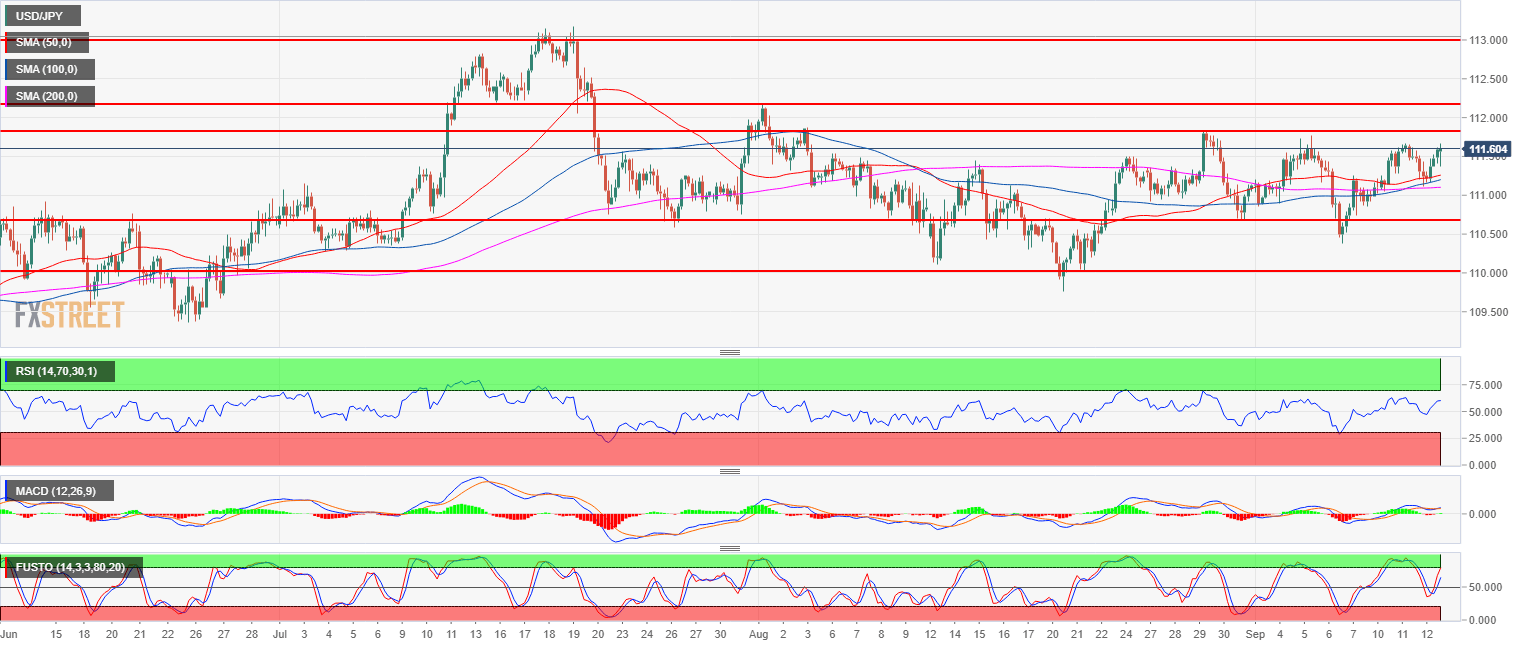
Spot rate: 111.58
Relative change: 0.29%
High: 111.67
Low: 110.15
Main trend: Bullish
Short-term trend: Neutral bellow 112.17
Resistance 1: 111.84 August 29 swing high
Resistance 2: 112.00-112.17 zone, figure and August 1, swing high
Resistance 3: 112.40 supply level
Resistance 4: 113.18, 2018 high
Support 1: 111.54 August 6, high
Support 2: 111.45 August 8 high
Support 3: 111.00 figure
Support 4: 110.75, July 23 swing low
Support 5: 110.00 figure
Support 6: 109.37 June 25 low
