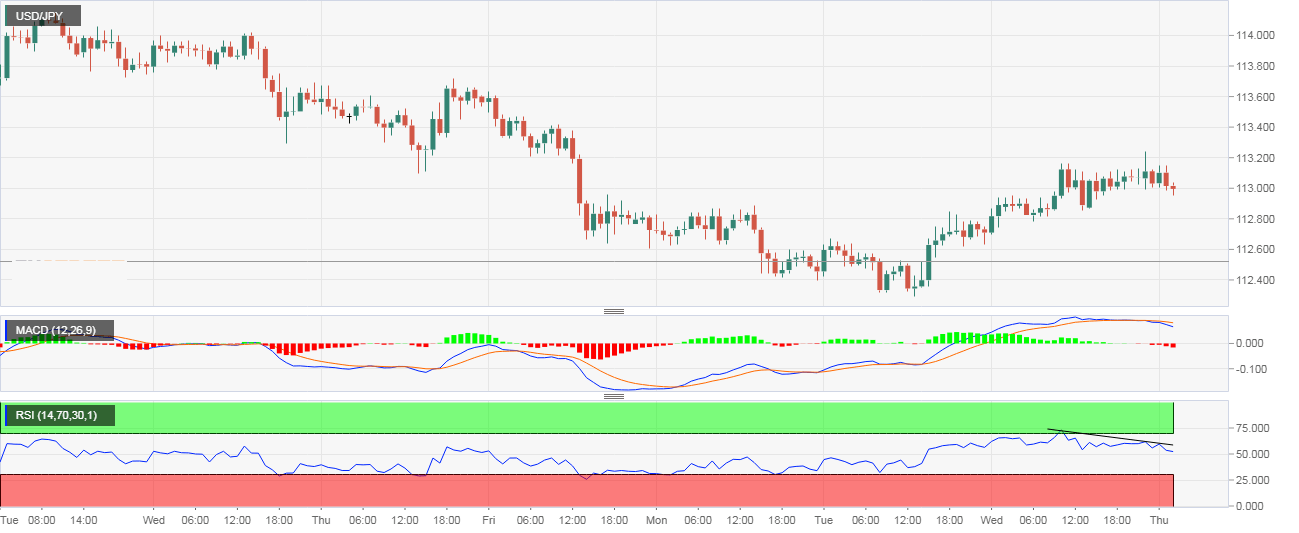
- The USD/JPY pair dipped below 113.00 soon before press time, adding credence to the bearish divergence of the relative strength index (RSI) seen in the hourly chart.
- The bearish development on the hourly RSI also indicates the recovery rally from the recent low of 112.30 has likely ended.
- The bearish RSI divergence would be invalidated if the pair rises above 113.23.
Hourly Chart
Trend: Bearish
USD/JPY
Overview:
Last Price: 112.99
Daily change: -8.0 pips
Daily change: -0.0708%
Daily Open: 113.07
Trends:
Daily SMA20: 113.12
Daily SMA50: 112.9
Daily SMA100: 112.09
Daily SMA200: 110.2
Levels:
Daily High: 113.16
Daily Low: 112.64
Weekly High: 114.22
Weekly Low: 112.64
Monthly High: 114.56
Monthly Low: 111.38
Daily Fibonacci 38.2%: 112.96
Daily Fibonacci 61.8%: 112.84
Daily Pivot Point S1: 112.75
Daily Pivot Point S2: 112.43
Daily Pivot Point S3: 112.23
Daily Pivot Point R1: 113.28
Daily Pivot Point R2: 113.48
Daily Pivot Point R3: 113.8
