- USD/MXN seesaws around 23.6% Fibonacci retracement, above 21-day SMA, after a three-day winning streak.
- A further downside could recall late-March lows, buyers can await a sustained break of March 24 top.
Following its U-turn from Monday’s record top, USD/MXN seesaws around 24.03, down 0.04% on the day, during the early Thursday’s Asian session.
The quote currently seesaws around 23.6% Fibonacci retracement of its February 27 to April 06 upside while also staying above 21-day SMA amid RSI’s step back from the overbought territory.
That said, the pair is likely to witness pullback moves towards 24.65/70 and 25.00 resistances whereas March 24 high near 25.45 holds the key to the pair’s record top surrounding 25.78.
Meanwhile, the pair’s daily closing below 21-day SMA level of 23.83 could drag the quote towards March 27 low near 22.86, which is also adjacent to 38.2% Fibonacci retracement.
USD/MXN daily chart
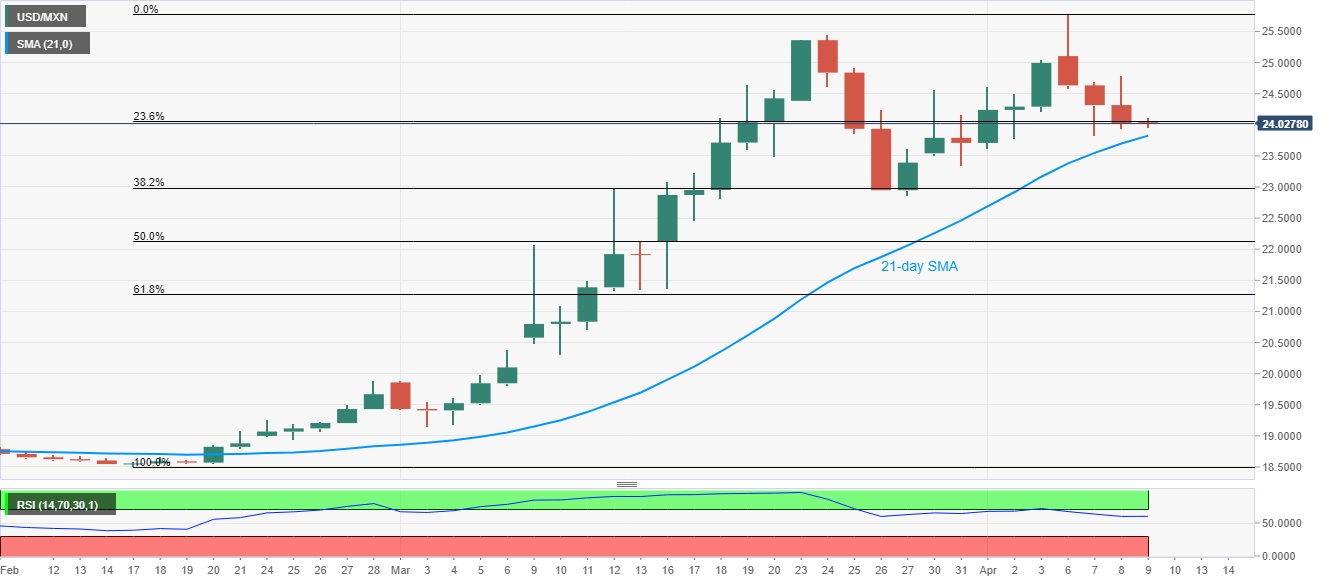
Trend: Pullback expected
