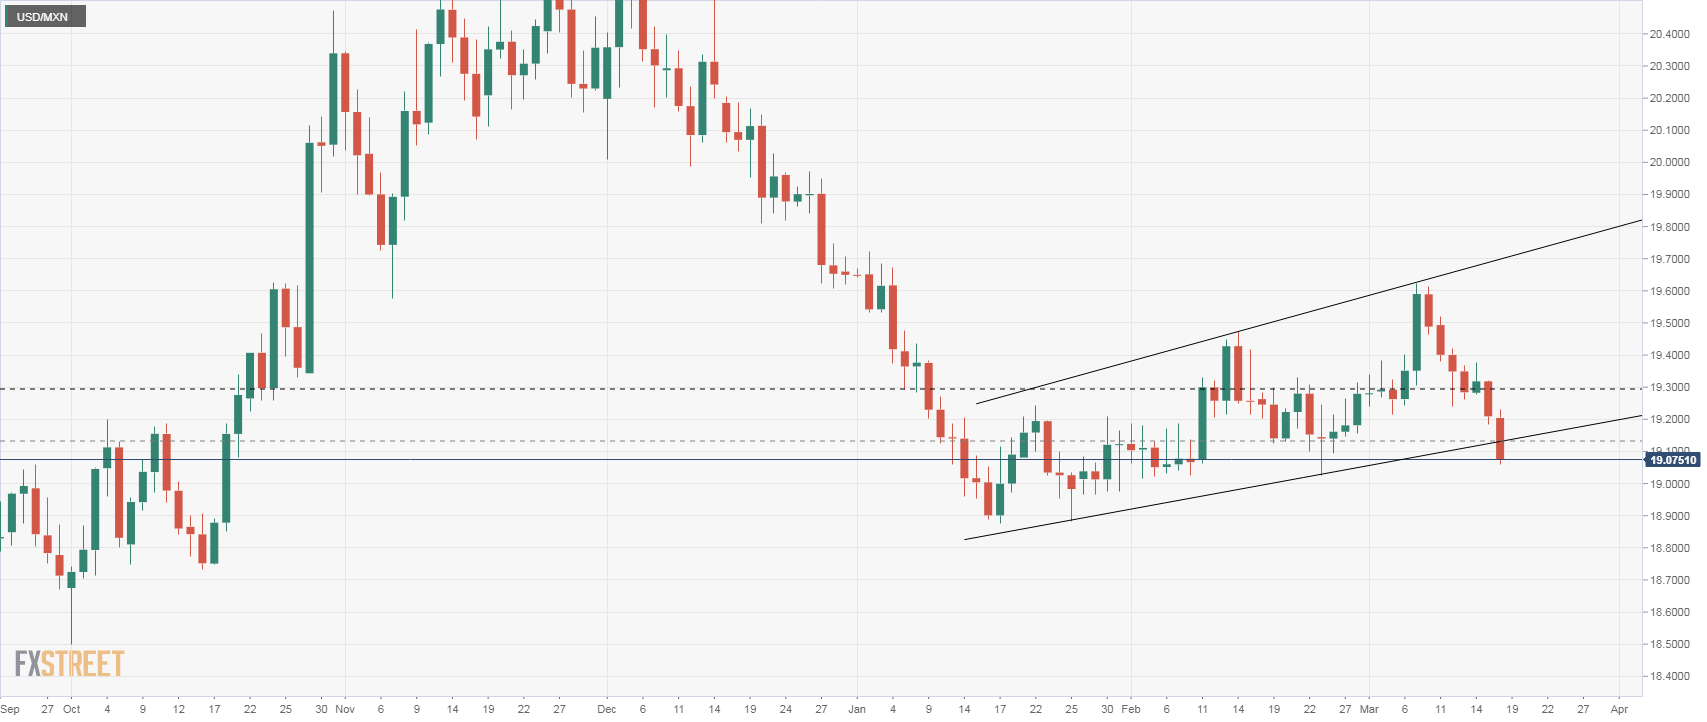
- The Mexican peso broke a key technical level and appears to be headed to further gains.
- On Friday, the USD/MXN dropped below 19.20, leaving it vulnerable to more losses in the short-term and today it is trading under an uptrend line that stands at 19.10. A confirmation under that area would point to a test of 19.00 with the odds favoring a break lower. The next zone to watch is 18.85/87, YTD lows.
- The US dollar needs to rise back above 19.20 to remove the intraday bearish bias, while under 19.30 the bearish outlook would remain intact.
USD/MXN Daily Chart
USD/MXN
Overview:
Today Last Price: 19.0702
Today Daily change: -0.1391 pips
Today Daily change %: -0.72%
Today Daily Open: 19.2093
Trends:
Daily SMA20: 19.2816
Daily SMA50: 19.1912
Daily SMA100: 19.6548
Daily SMA200: 19.4162
Levels:
Previous Daily High: 19.3201
Previous Daily Low: 19.1846
Previous Weekly High: 19.5204
Previous Weekly Low: 19.1846
Previous Monthly High: 19.4726
Previous Monthly Low: 19.0168
Daily Fibonacci 38.2%: 19.2363
Daily Fibonacci 61.8%: 19.2683
Daily Pivot Point S1: 19.1559
Daily Pivot Point S2: 19.1024
Daily Pivot Point S3: 19.0203
Daily Pivot Point R1: 19.2914
Daily Pivot Point R2: 19.3735
Daily Pivot Point R3: 19.427
