- USD/TRY extends recovery from two-month low while piercing 50% Fibonacci retracement off-late.
- One-week-old falling trend line lures buyers ahead of 50-day SMA.
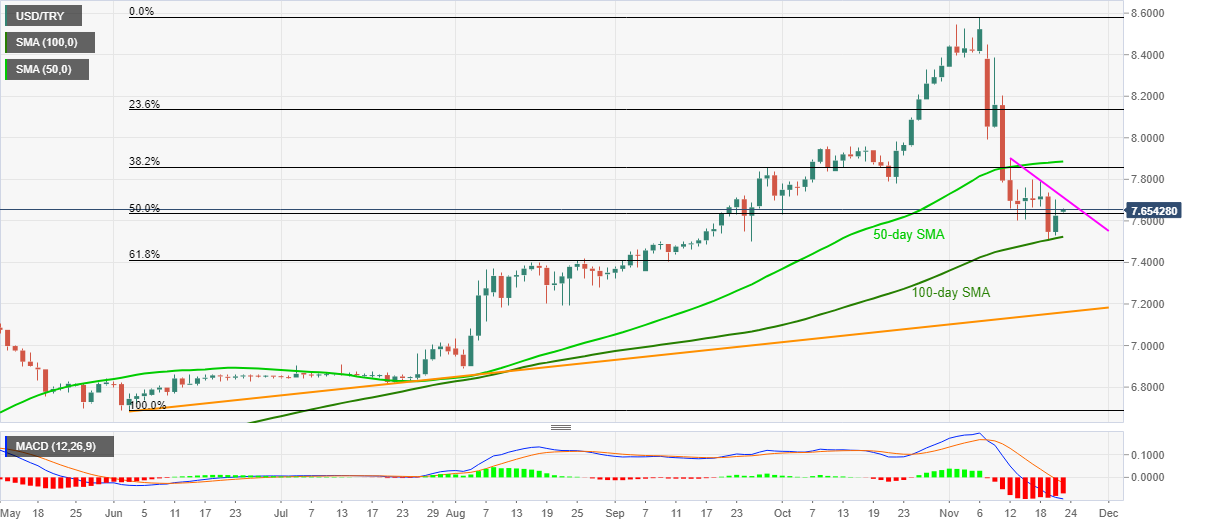
- Bearish MACD, immediate resistances question the bullish momentum.
USD/TRY flirts with the intraday high of 7.6584, currently up 0.39% around 7.6542, during Monday’s Asian session. In doing so, the pair crosses 50% Fibonacci retracement of June-November upside while stretching Thursday’s bounce off 100-day SMA.
Strong SMA support joins the recent upside break of the key Fibonacci retracement to direct USD/TRY buyers towards a descending trend line from November 12, at 7.7135 now. However, bearish MACD signals challenge the pair’s further upside.
Not only the short-term resistance line but 50-day SMA near 7.8860 also challenge the USD/TRY bulls.
Alternatively, a downside break of 50% Fibonacci retracement level of 7.6338 can re-direct the USD/TRY sellers to a 100-day SMA level of 7.5160.
During the quote’s sustained downside past-7.5160, 61.8% Fibonacci retracement, at 7.4100, will be the key support to watch.
USD/TRY daily chart
Trend: Further recovery expected
