- The Turkish Lira has appreciated to fresh 2-week highs vs. the greenback following yesterday’s rate hike by the CBRT by more than 600 bp, so far finding support in the proximity of the 6.00 handle.
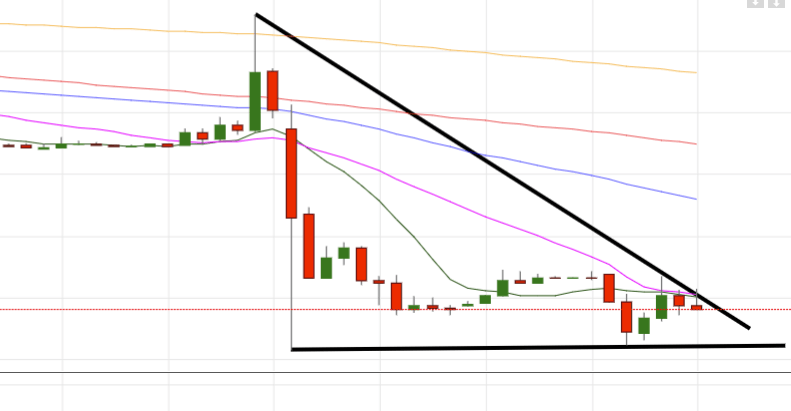
- The likelihood of a ‘descending triangle’ formation in the hourly chart gives support to the idea that further downside appears probable in the near term.
- Interim targets on the downside emerge at yesterday’s low at 6.0167 ahead of 5.6675 (low August 16).
USD/TRY hourly chart
Daily high: 6.1471
Daily low: 6.0040
Support Levels
S1: 6.0167
S2: 5.6675
S3: 5.5616
Resistance Levels
R1: 6.3218
R2: 6.4345
R3: 6.8350
