- The pair moved higher to the 5.32 region.
- The softer tone in the greenback helps the correction lower.
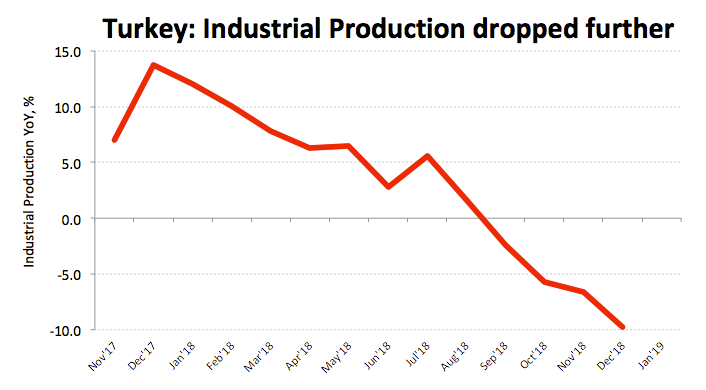
- Turkey Industrial Production contracted nearly 10% YoY in December.
After a brief test of daily highs in the 5.32 neighbourhood, USD/TRY has sparked a correction lower to sub-5.300 levels.
USD/TRY clinches monthly highs at 5.3200
In spite of the current knee-jerk, the pair keeps navigating monthly peaks backed by the rally in the buck since the start of February. In fact, the EM FX space has come under renewed selling pressure vs. the greenback in response to the deteriorated sentiment around the riskier assets.
TRY has derived extra selling pressure today after Industrial Production in Turkey contracted at an annualized 9.8% on a year to December, more than initially estimated.
Additional data saw the domestic Current Account returning to the deficit territory at $1.44 billion in December, albeit bettering prior surveys.
What to look for around TRY
TRY has remained somewhat stable in past months due to an improved discipline from the CBRT, the continuation of the tightening cycle by the central bank and the renewed flexible stance from the Federal Reserve. However, the persistent deterioration in domestic fundamentals, the permanent conflict between Erdogan’s government and the central bank and potential geopolitical risks could spark the resumption of some accommodation in monetary policy later in the year, putting the Lira under pressure. The upcoming local elections in March could also spark some bouts of volatility in TRY.
USD/TRY key levels
At the moment the pair is gaining 0.33% at 5.3005 facing the next hurdle at 5.3196 (high Feb.14) seconded by 5.3406 (200-day SMA) and finally 5.3623 (high Jan.29). On the downside, a breach of 5.2652 (21-day SMA) would expose 5.2435 (10-day SMA) and then 5.1594 (2019 low Jan.31).