- USD/ZAR stays on the back foot for the fourth day in a row.
- The pullback from 50-day EMA, a two-month-old resistance line favors the bears.
- Bulls can quickly refresh the monthly top on the upside break of 17.45/50.
USD/ZAR prints 0.28% loss while declining to 17.20 during Wednesday’s Asian session. In doing so, the quote portrays a four-day losing streak while justifying a pullback from 50-day EMA and a falling trend line from April 24.
Considering the pair’s U-turn from the key resistance, coupled with the normal RSI conditions, the USD/ZAR prices are likely to remain depressed. As a result, a 100-day EMA level of 17.10, followed by 17.00 round-figure, seems to lure the short-term sellers.
If the bearish momentum extends below 17.00, the previous week low near 16.89 and June 10 top surrounding 16.68 might entertain the pessimists ahead of pleasing them with the monthly low of 16.34.
Meanwhile, a successful rise past-17.45/50 resistance confluence will trigger the pair’s surge towards challenging the monthly peak near 17.62 and May 29 top close to 17.70.
During the pair’s additional rise past-17.70, April 30 bottom adjacent to 18.00 could lure the bulls.
USD/ZAR daily chart
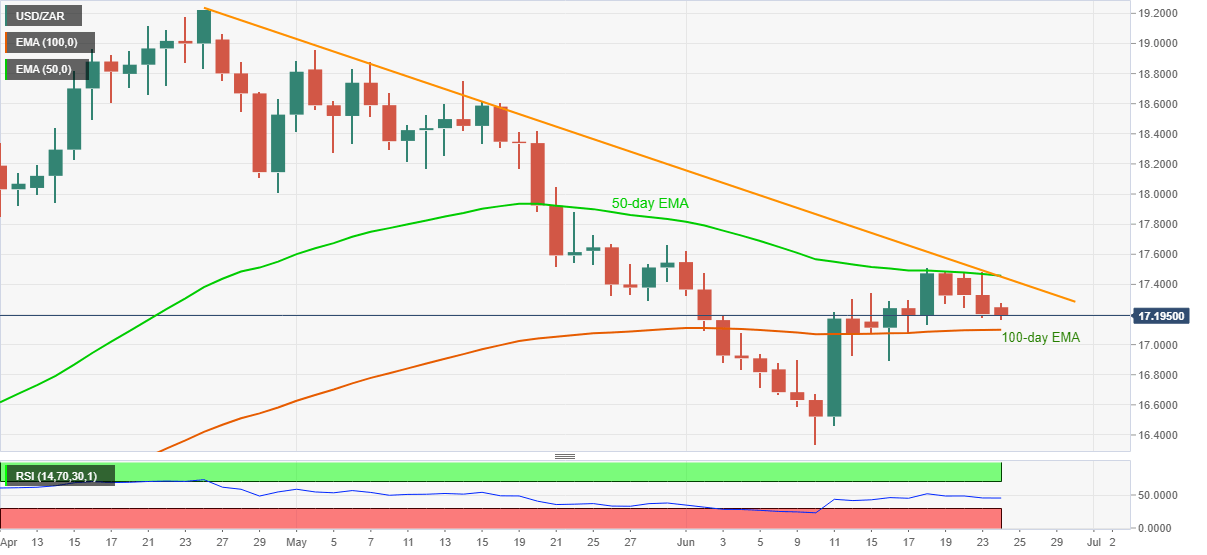
Trend: Bearish
