- USD/ZAR bounces off the lowest since March 16.
- A short-term key resistance confluence may gain support from bearish MACD to disapprove buyers.
- A sub-16.00 area is on the bears’ radars, 200-HMA adds to the upside barriers.
USD/ZAR carries pullback from 16.34 while taking rounds to 16.50 during Thursday’s Asian session. The quote seems to cheer the U-turn of the RSI line from the oversold region. Though, a confluence of 100-HMA and a descending trend line from June 02 stands tall to disappoint the bulls.
In addition to the 16.72/73 immediate resistance, a 200-HMA level of 16.96 and 17.00 threshold also raise bars for the buyers’ entry.
If at all the quote crosses the 17.00 mark, it can challenge the monthly top near 17.56. However, June 04 high close to 17.10 may act as an intermediate halt during the rise.
Meanwhile, the pair’s fresh downside under the recent low of 16.34 can aim for 16.12 and 16.00 round-figure whereas March 02 high near 15.86 could offer breathing space to the bears afterward.
USD/ZAR hourly chart
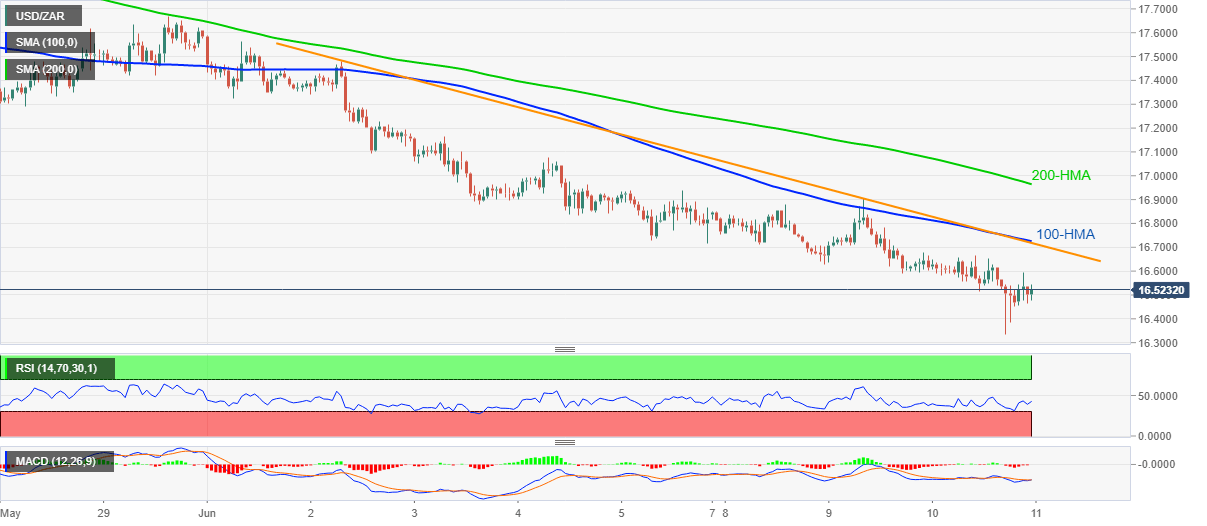
Trend: Bearish
