- USD/ZAR seesaws near three-week low amid bearish MACD.
- The near-term strong support area could trigger bounce to 100-bar SMA.
- June month’s low could lure the sellers below 16.88.
USD/ZAR struggles to keep the sellers happy around 16.97 during the early Friday morning in Asia. The pair’s sustained trading below the key SMAs joins bearish MACD to suggest further downside. Though, one-month-old horizontal support comprising 23.6% Fibonacci retracement of May 14 to June 10 fall offers hopes of a bounce.
In doing so, a 100-bar SMA level of 17.21 will be the adjacent resistance ahead of pushing the buyers to confront 17.25/26 confluence including 200-bar SMA and 38.2% Fibonacci retracement.
During the quote’s sustained break above 17.26, buyers may aim for 17.42 and 50% Fibonacci retracement level of 17.55. Additionally, May 29 top and 61.8% Fibonacci retracement, respectively near 17.67 and 17.83, could challenge further upside momentum.
Alternatively, the quote’s failure to bounce off 16.88/90 area could extend the recent weakness towards 16.67 and then to June month’s bottom surrounding 16.33.
If at the USD/ZAR prices continue to drop after 16.33, the 61.8% Fibonacci retracement of the pair’s January-April upside, near 15.98, will be the key support to watch.
USD/ZAR four-hour chart
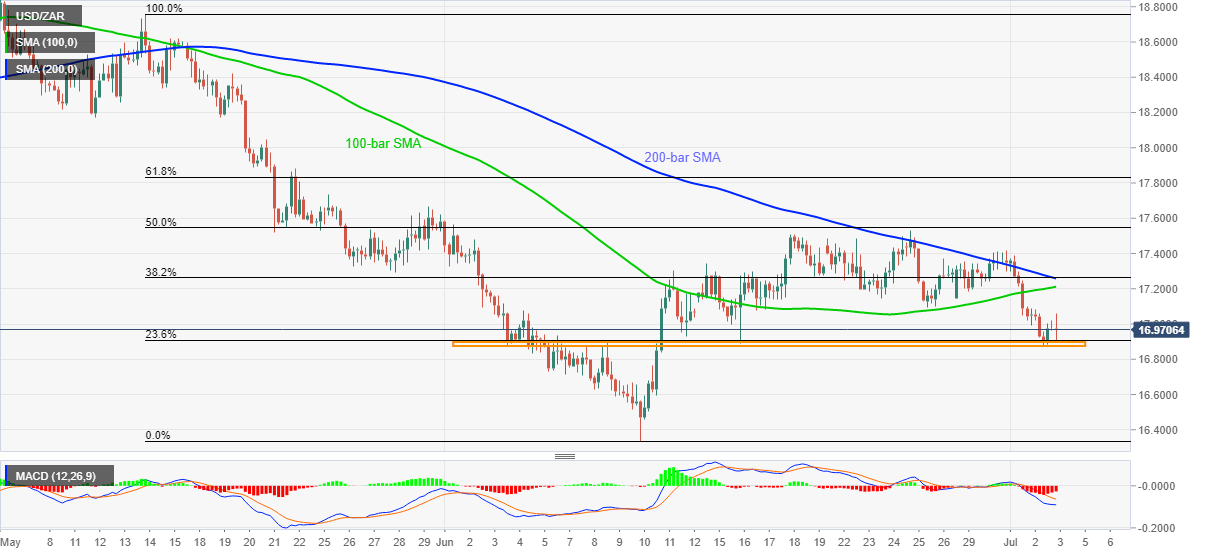
Trend: Pullback expected
