- USD/ZAR stays on the back foot under a multi-day low below 16.70.
- A sustained break below 100-day SMA and the key Fibonacci retracement level keeps the sellers hopeful.
- A three-week-old descending trend line adds to the upside barriers.
USD/ZAR drops to 16.67, down 0.10% on a day, during the initial Asian session on Tuesday. In doing so, the quote revisits the lowest levels since March 18 on the break of 61.8% Fibonacci retracement of March-April upside.
In addition to the pair’s break below the key Fibonacci retracement, bearish MACD and sustained trading under 100-day SMA also favors the sellers.
As a result, the 16.00 threshold is well on the bears’ radars with a 200-day SMA level of 15.80 likely limiting the further downside.
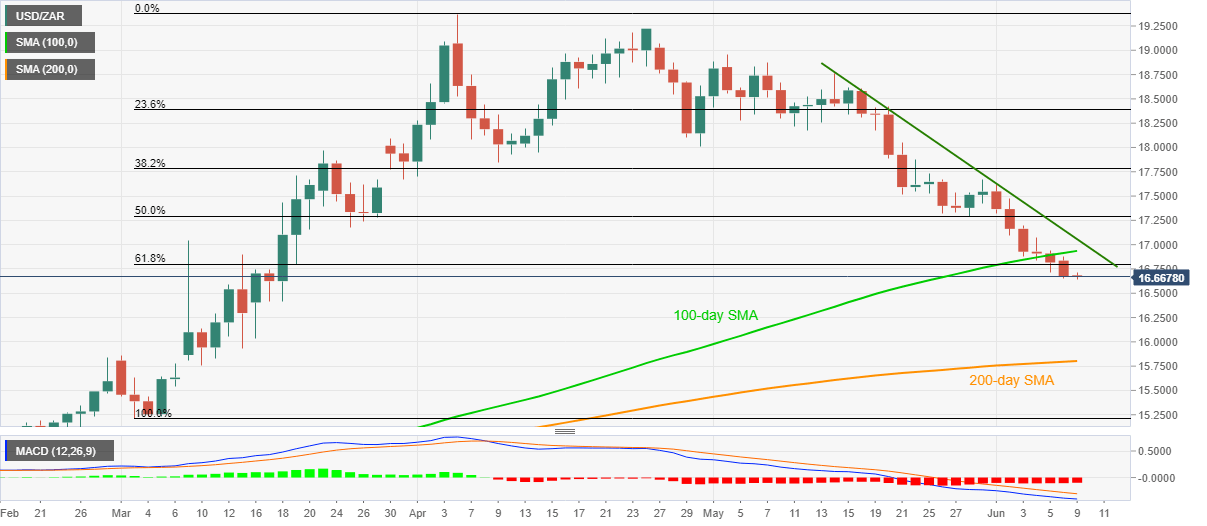
Meanwhile, an upside clearance of 61.8% Fibonacci retracement, at 16.80, as well as the pair’s rise past-100-day SMA level of 16.94, will require validation from a falling trend line from May 14, at 17.06 now, to register its strength.
USD/ZAR daily chart
Trend: Bearish
