USD/CAD jumped last week, following the Fed announcement, but the pair then retracted, and closed the week almost unchanged, at 1.0633. This week’s only release is GDP. Here is an outlook on the major market-movers and an updated technical analysis for USD/CAD.
The US dollar gained ground following the dramatic Fed statement that it would taper QE by $10 billion starting in January. However, the greenback lost ground after weak releases on Thursday, led by Unemployment Claims, which was much higher than the estimate. Canadian Core Retail Sales looked sharp on Friday, and this helped the Canadian dollar make up make up almost all of the losses sustained earlier in the week.
[do action=”autoupdate” tag=”USDCADUpdate”/]USD/CAD daily chart with support and resistance lines on it. Click to enlarge: 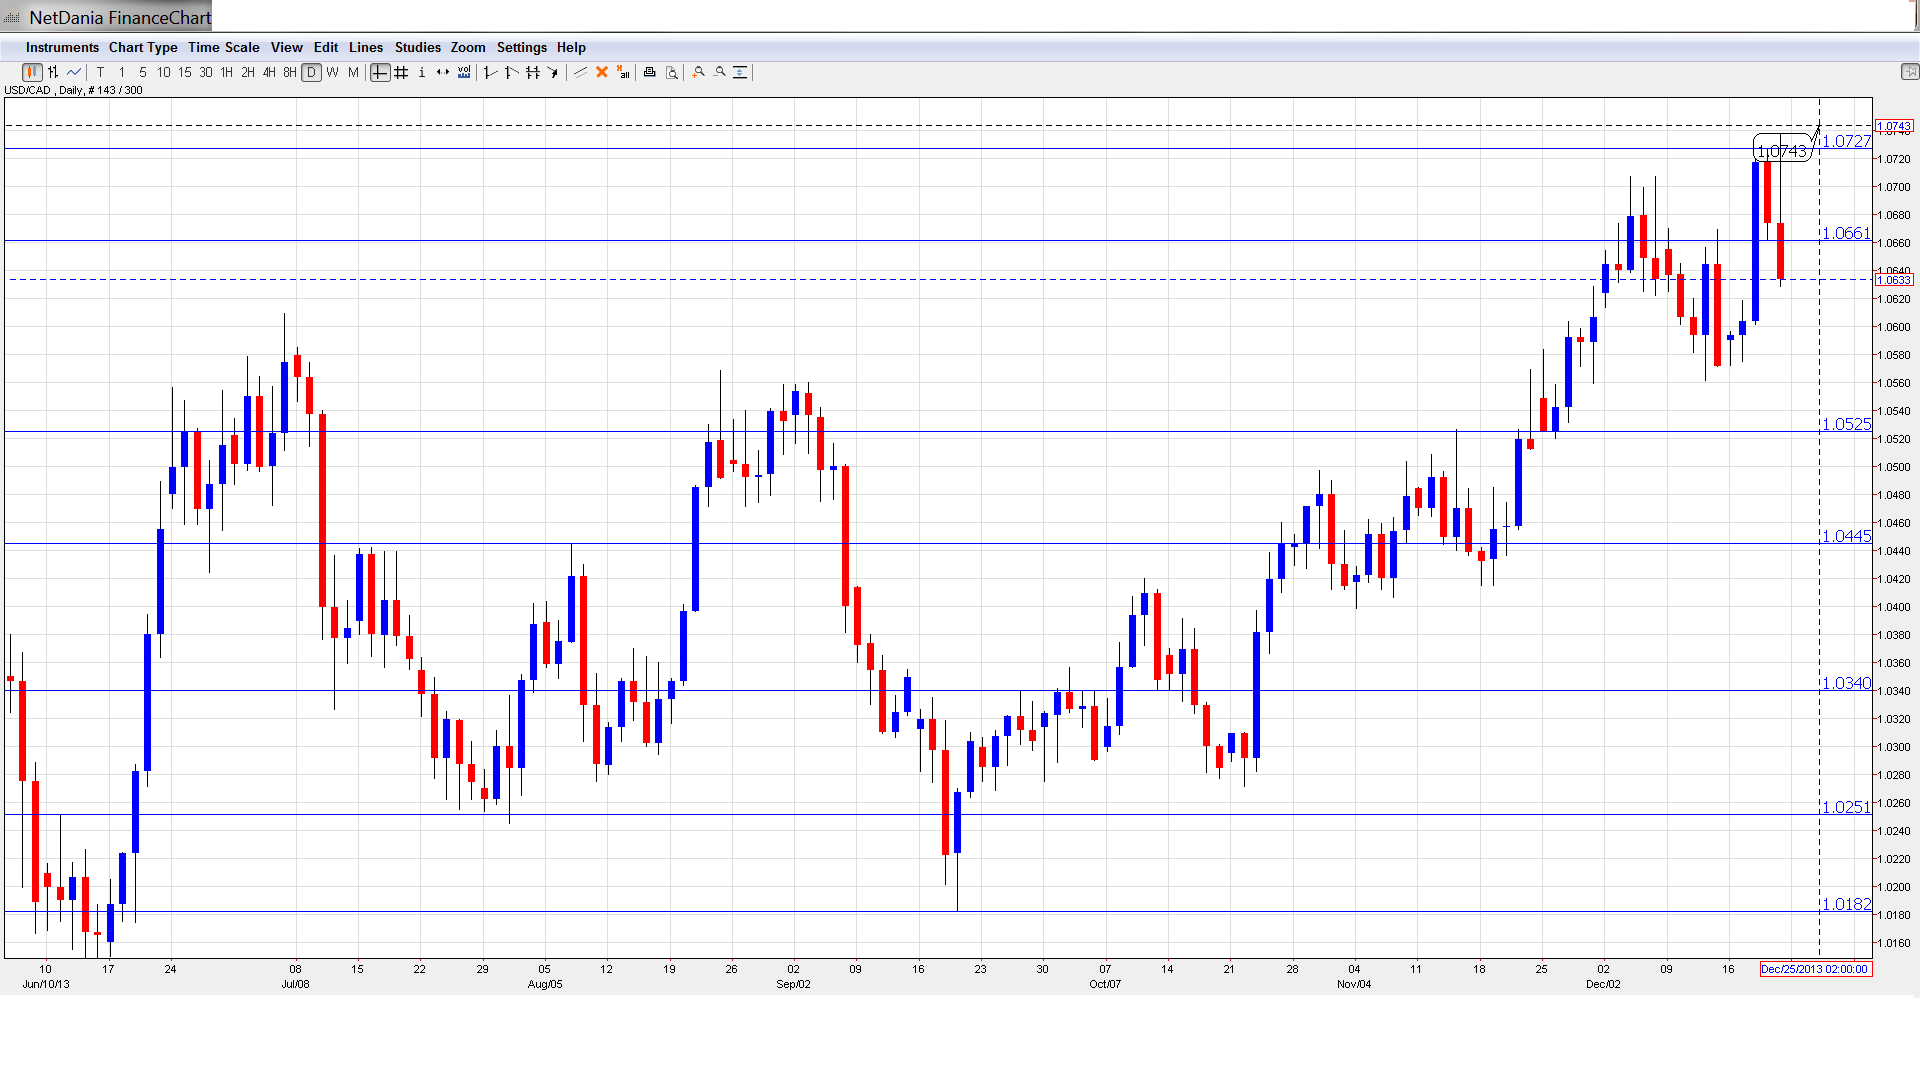
- GDP: Monday, 13:30. GDP, which measures economic output, is one of the most important economic indicators and can have a major effect on the movement of USD/CAD. Canadian GDP is released every month, unlike most other developed economies which release GDP every quarter. The past two releases have seen gains of 0.3%, each of which beat their estimates. The markets are expecting a weaker of reading of just 0.1% for December.
* All times are GMT.
USD/CAD Technical Analysis
USD/CAD opened the week at 1.0590 and touched a low of 1.0572. The pair then reversed directions, and barreled above the 1.07 line, hitting a high of 1.0719, as resistance at 1.0723 (discussed last week) held firm. The pair then retracted, closing the week at 1.0623.
Live chart of USD/CAD: [do action=”tradingviews” pair=”USDCAD” interval=”60″/]
Technical lines, from top to bottom:
We begin with resistance at 1.1124. This line has remained intact since July 2009, when the Canadian dollar showed sharp volatility, trading as high as the 1.17 level.
The next resistance line is 1.0945, which is protecting the key 1.10 level. This line has not been tested since September 2009.
Next is resistance at 1.0853. This line has held firm since May 2010.
1.0723 was a cap in mid-2010, before the US dollar tumbled and dropped all the way into 0.93 territory. This line faced pressure for the second straight week, as the greenback continues to press hard against the Canadian dollar. The pair was unable to break through and this line remains in a resistance role.
1.0660 has had a busy December and was briefly breached again this week. It is a weak resistance line, and could see action early in the week.
1.0523 was a peak back in November 2011 and is the first line of support.
1.0446 has held since mid-November, when the US dollar continued a rally which saw it break above the 1.07 line.
1.0340 had a busy October and is providing strong support. 1.0250 is next. This line has held firm since mid-September.
1.0180 provided support for the pair during March, and saw a lot of activity in the first half of June. It remains a strong support line.
The round number of 1.01 was a trough back in July 2012 and switched to resistance afterwards. The line proved its strength several times in 2013, most recently in mid-May.
Our final support level for now is the round number of parity. This is a clear line which has not been tested since mid-February.
I am bullish on USD/CAD
The Canadian dollar remains under pressure as USD/CAD continues to test the waters above the 1.07 line. With QE taper a reality, we could see the US dollar gain ground. Despite some setbacks last week, the US economy is improving at a faster clip than the Canadian, and this will likely make it difficult for the Canadian dollar to keep pace with its US counterpart.
Further reading:
- For a broad view of all the week’s major events worldwide, read the USD outlook.
- For EUR/USD, check out the Euro to Dollar forecast.
- For the Japanese yen, read the USD/JPY forecast.
- For GBP/USD (cable), look into the British Pound forecast.
- For the Australian dollar (Aussie), check out the AUD to USD forecast.
- USD/CAD (loonie), check out the Canadian dollar.
