The Canadian dollar lost over a cent this week, as USD/CAD closed just above the 1.11 line. There are three events this week, highlighted by GDP. Here is an outlook on the major events and an updated technical analysis for USD/CAD.
The loonie took in on the chin on Friday, as a sharp decline in Retail Sales sent the currency sharply lower. US releases continues to sputter, as the Philly Fed Manufacturing Index and Existing Home Sales slipped badly in January.
[do action=”autoupdate” tag=”USDCADUpdate”/]USD/CAD daily chart with support and resistance lines on it. Click to enlarge: 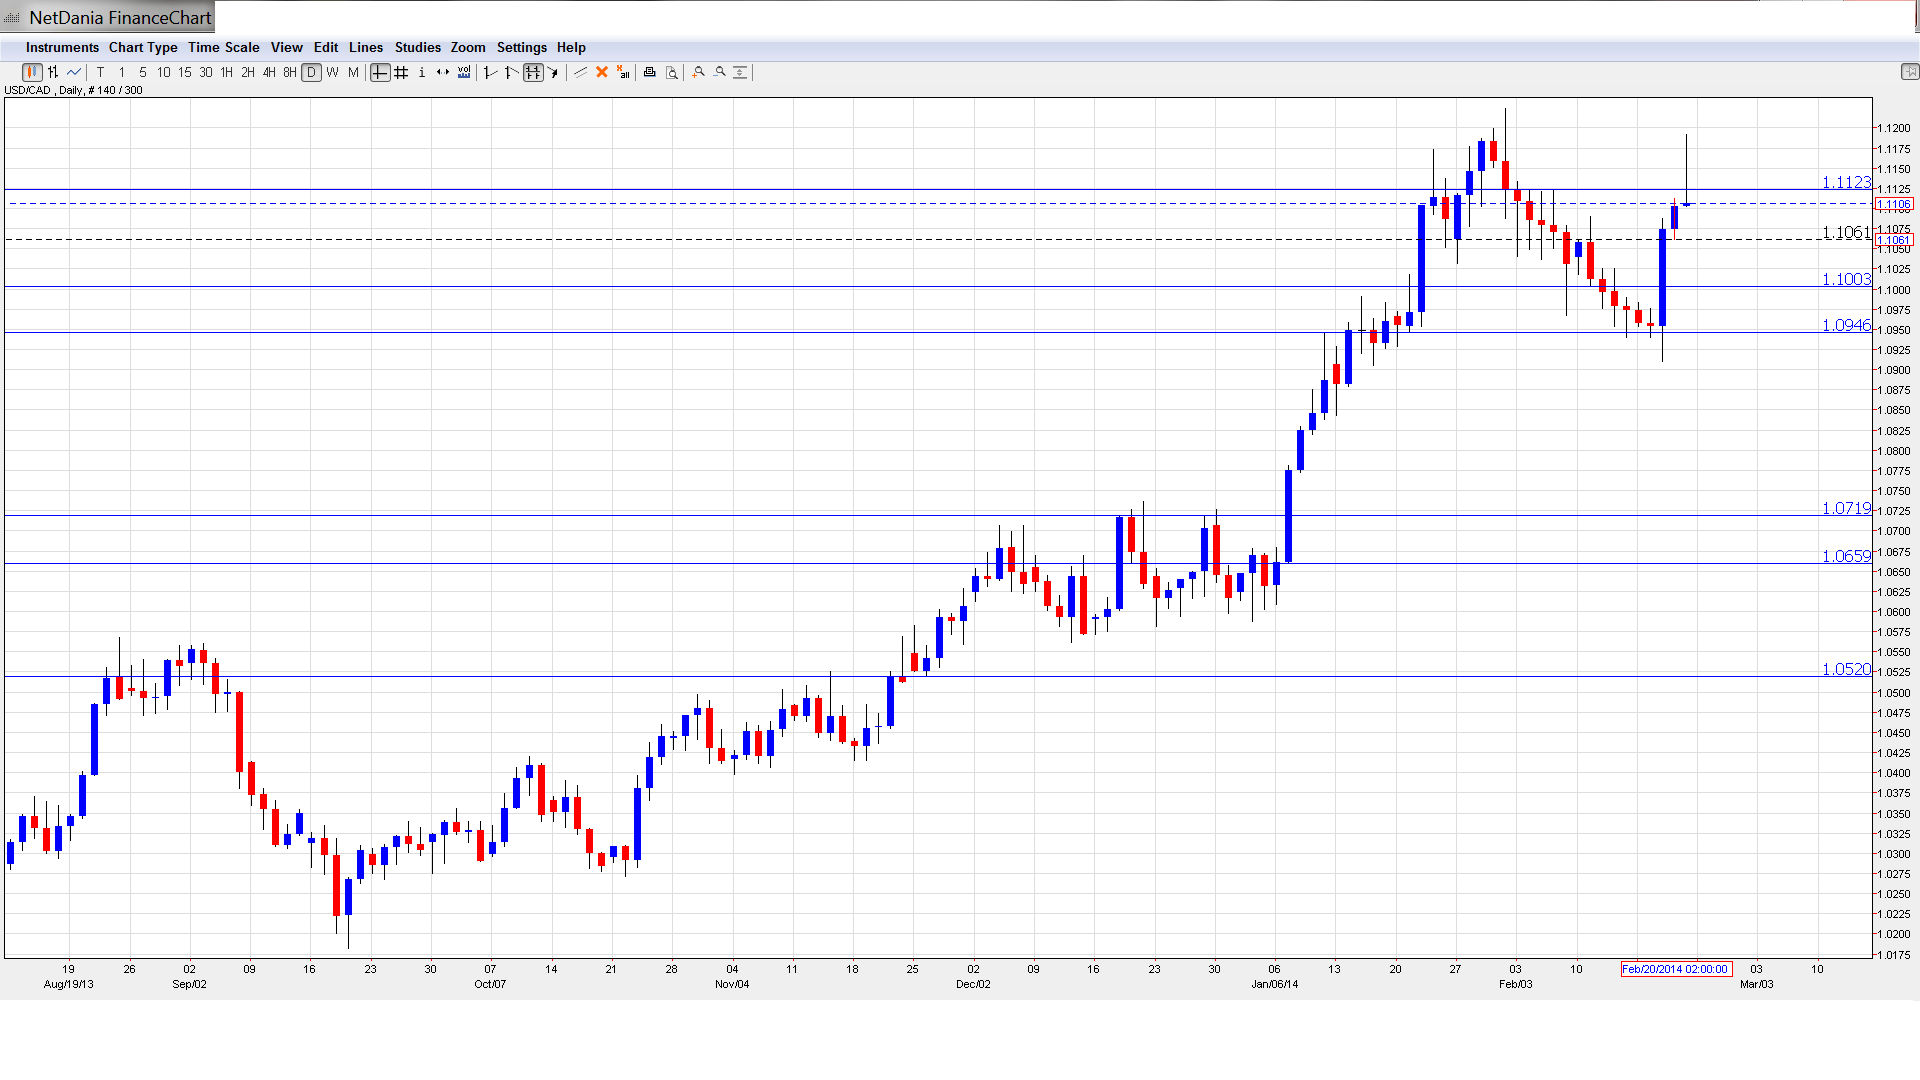
- Corporate Profits: Tuesday, 13:30. Corporate Profits is released every quarter, magnifying the impact of each release. The indicator registered a healthy gain of 1.5% in Q3, following two straight declines. The markets will be hoping for a another solid gain in Q4.
- Current Account: Thursday, 13:30. Current Account is closely linked to currency demand, as a rising deficit indicates that foreigners are cutting down on their purchases of Canadian dollars to buy Canadian goods and services. The deficit widened last month to -$15.5 billion, well above the estimate of -$14.3 billion. The downward trend is expected to continue in January, with an estimate of -$16.5 billion.
- GDP: Friday, 13:30. GDP is one of the most important economic events and is the highlight the week. Unlike most other major economies, Canada releases GDP on a monthly basis. The indicator continues to post modest gains, and the December reading came in at 0.2%, matching the forecast. The markets are bracing for a decline of 0.2% in January, which would mark the first contraction since July. If GDP does remain in positive territory, the loonie could get a boost.
*All times are GMT.
USD/CAD Technical Analysis
USD/CAD opened the week at 1.0974 and quickly dropped to 1.0910. It was all uphill from there, as the pair barreled higher and hit a high of 1.1192. The pair closed at 1.1106.
Live chart of USD/CAD: [do action=”tradingviews” pair=”USDCAD” interval=”60″/]
Technical lines, from top to bottom:
We start with resistance at 1.1617. This line marked a high point for the pair in July 2009, at which time the Canadian dollar posted a rally in which USD/CAD dipped below the 0.94 line.
1.1535 provided key support back in early 2007. It has been a resistance line since July 2009.
1.1369 fell in October 2008 as the US dollar posted sharp gains, climbing as high as the 1.21 level.
1.1124 is the next line of resistance. It has some breathing room as the Canadian dollar improved last week.
The key psychological barrier of 1.10 has switched to a support role. It is a weak line and could see activity early in the week.
1.0945 was breached last week but remains in place. It is currently a weak support line.
1.0853 is the next support line. 1.0723 was a cap in mid-2010, before the US dollar tumbled and dropped all the way into 0.93 territory. It remains a strong support line.
1.0660 saw a lot of activity in the second half of December and continues to provide strong support.
The final support line for now is 1.0523. It was a peak back in November 2011 and has provided support since late November 2013.
I am bullish on USD/CAD
The Canadian dollar has had a rough start to 2014 and has not received much support from Canadian economic releases, as the economy continues to underperform. If GDP does contract this week, as expected, the loonie could take a hit. US numbers have dipped recently, but market sentiment still remains positive with regard to the US economy, and the Fed is expected to continue tapering QE, which is positive for the US dollar.
Further reading:
- For a broad view of all the week’s major events worldwide, read the USD outlook.
- For EUR/USD, check out the Euro to Dollar forecast.
- For the Japanese yen, read the USD/JPY forecast.
- For GBP/USD (cable), look into the British Pound forecast.
- For the Australian dollar (Aussie), check out the AUD to USD forecast.
- USD/CAD (loonie), check out the Canadian dollar.
