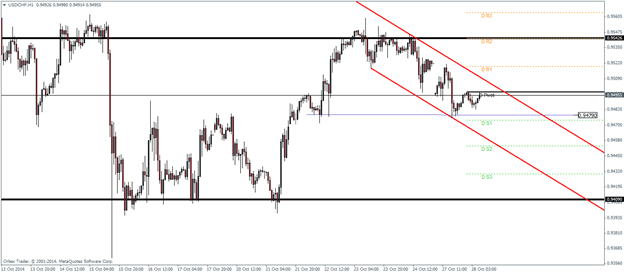
USDCHF
USDCHF has been trading in a down trend price channel making it an interesting pair as price could break out to either sides. On the H1 charts, we can see that price is currently trading below the daily pivot point, a bit higher after making a swing low point. A break above the pivot point and eventually rising out of the down sloping trend line, could see a retest of the pivot level at 0.9496 region for a move higher. On the larger time frames, we also notice a major bullish flag pattern being formed, which puts the bias to the upside. Key resistance at 0.9542 will have to be cleared for any upside gains. For possible declines, USDCHF will have to break the minor support level formed at 0.9479, which could see price gradually move lower, with the possible decline towards major support at 0.9490
USDCHF Pivot Levels
| R3 | 0.9563 |
| R2 | 0.954 |
| R1 | 0.9519 |
| Pivot | 0.9495 |
| S1 | 0.9475 |
| S2 | 0.9453 |
| S3 | 0.943 |
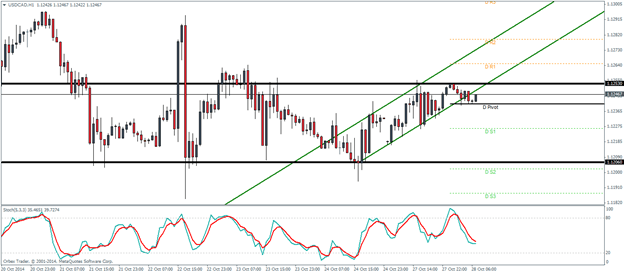
USDCAD
The loonie has been mostly mixed since last week and as we can see on the hourly charts, price has been stuck to a tight range, while trading within an uptrend price channel having only broken out of it recently. The current minor gains we see is most likely going to find resistance near the lower price channel, close to the major resistance at 1.1253. If the resistance holds and we see a break below 1.124, we can expect to see further declines in USDCAD towards the support level of 1.1206 regions. The Stochastics oscillator has been bearish but we cannot rule out a bullish cross over as price heads higher to test the resistance level. A break of the resistance could see USDCAD get back into its bullish rally confirmed by a break out and test of the resistance at 1.1253
USDCAD Pivot Levels
| R3 | 1.13 |
| R2 | 1.1279 |
| R1 | 1.1262 |
| Pivot | 1.124 |
| S1 | 1.1226 |
| S2 | 1.12 |
| S3 | 1.1187 |
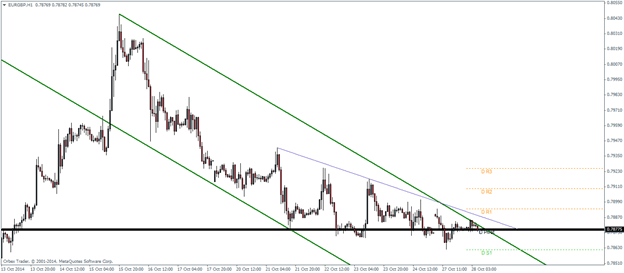
EURGBP
EURGBP has been ranging tightly with no clear direction or bias. From the H4 charts, when we construct the downtrend price channel we see that EURGBP is currently trading near a swing pivot level support at 0.78775. For further declines, we will have to see a successful test of this support level for resistance. To the downside, the declines could hold near 0.7814, the measured price objective of the descending triangle shown on the chart followed by further declines to the previous yearly low at 0.777 level, where price previously managed to bounce off.
Alternatively, if price does break out of the downtrend channel we can expect to see a test of 0.78775 for support before further gains can be expected.
Fundamentally, there is not much of data that could possibly affect the EURGBP pair, with the exception of the FOMC minutes which could bring some volatility into this pair. Later this week, key data from Eurozone includes the German and Eurozone CPI data, which incidentally, at least in the case of Eurozone has been showing signs of being resilient. The flash estimates are the early estimates and a positive or a better than expected reading could breathe some life back into EURGBP and could result in a possible bullish correction to the declines.
EURGBP Pivot Levels
| R3 | 0.7925 |
| R2 | 0.7906 |
| R1 | 0.7893 |
| Pivot | 0.7874 |
| S1 | 0.7859 |
| S2 | 0.7846 |
| S3 | 0.7826 |