USD/JPY reversed direction last week, as the Japanese yen posted modest gains. The pair closed the week at 97.69. This week’s schedule is very light, with just four releases. Here is an outlook on the major market-movers and an updated technical analysis for USD/JPY.
The US dollar was broadly weaker last week , as initial optimism over the debt deal quickly faded . The agreement reached in Congress is only for a few months, as the underlying budgetary issues are yet to be resolved.
[do action=”autoupdate” tag=”USDJPYUpdate”/]USD/JPY daily chart with support and resistance lines on it. Click to enlarge: 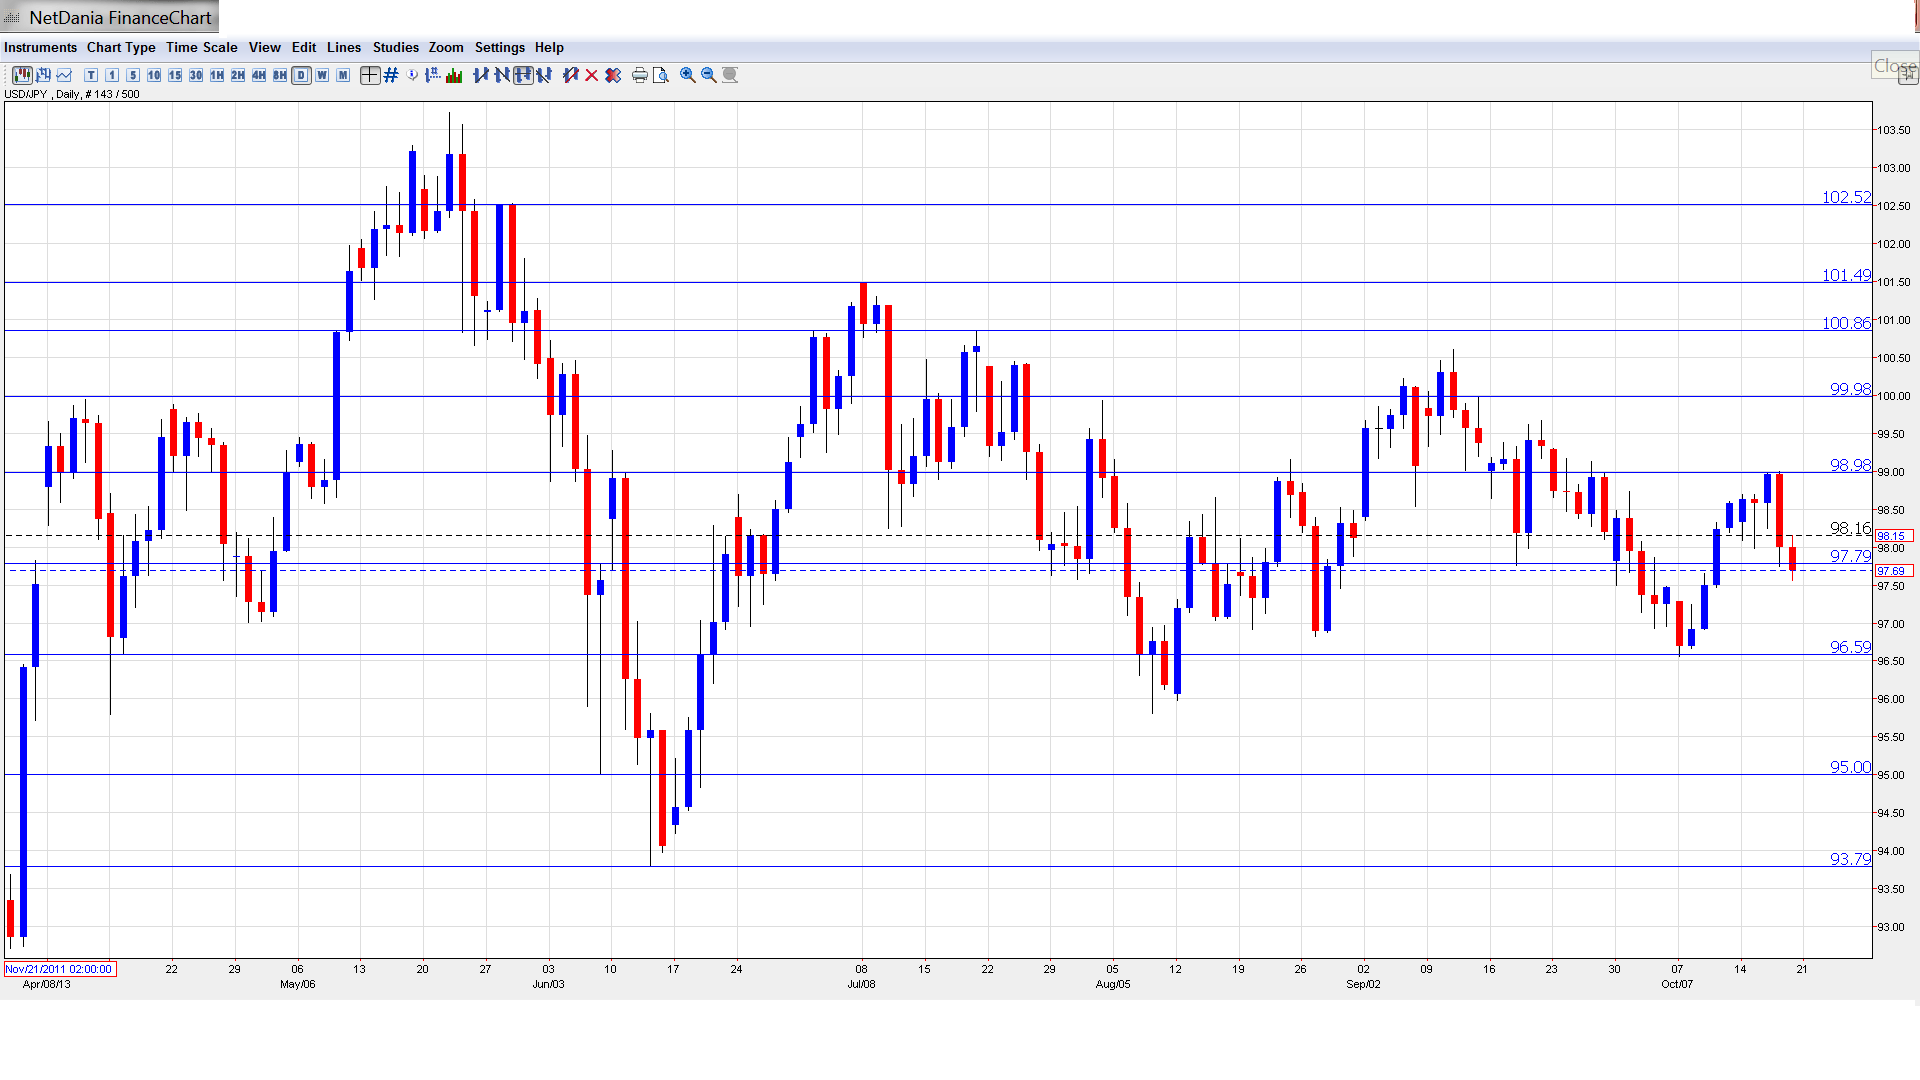
- Trade Balance: Sunday, 23:50. Japan continues to post monthly trade deficits. The August release showed improvement, narrowing to -0.79 trillion yen. This beat the estimate of -0.83 trillion. The markets are bracing for a weak release for September, with an estimate of -1.06 trillion.
- All Industries Activities: Monday, 4:30. This indicator looks at the total amount of goods and services purchased by businesses. After posting a decline in August, the indicator rebounded last month with a gain of 0.5%. This beat the estimate of 0.3%. The forecast for the September release stands at 0.3%.
- Tokyo Core CPI: Thursday, 23:30. Tokyo Core CPI is considered the most important inflation indicator and can affect the movement of USD/JPY. The index has been posting gains in recent months as we see inflation in the Japanese economy. The index posted a gain of 0.2% in August, and the estimate for September stands at 0.4%.
- CSPI: Thursday, 23:50. The Corporate Services Price Index has also been posting gains in recent months, and came in at 0.6% in August, a multi-year high. The markets are expecting the upward trend to continue, with an estimate of 0.8%.
* All times are GMT
USD/JPY Technical Analysis
We start with resistance at the round number of 104. This was a key line back in May 2008. At that time, USD/JPY was in the midst of a rally which saw the pair climb as high as 110.
102.50 was an important resistance line in late May but has not been tested since that time.
101.44 was the post-crisis high seen in April 2009, and has not been tested since mid-July. 100.85 saw activity in July as the dollar showed strength.
100, a key level, saw some activity in September and continues to provide resistance.
98.90 was breached as the dollar showed strength early in the week, but remains intact as a strong resistance line.
97.80 has reverted to a resistance role. It is a weak line and could be tested early in the week.
96.59 continues to provide strong support. It has held firm since mid-August.
The round number of 95 is a psychologically significant line. It has held firm since mid-June.
93.79 marked the low point of a rally by USD/JPY which started in mid-June and saw the pair climb to the mid-101 range in July.
The final support level for now is 92.88, which last saw activity in April.
I am bearish on USD/JPY
With the fiscal crisis in Washington over, at least for a few months, the markets will be focusing on economic data. Non-Farm Payrolls will be released early this week, and if the numbers are not good, the dollar could lose ground. Meanwhile, Japanese inflation numbers continue to improve, and the yen could get a boost from respectable inflation numbers this week.
- For a broad view of all the week’s major events worldwide, read the USD outlook.
- For EUR/USD, check out the Euro to Dollar forecast.
- For GBP/USD (cable), look into the British Pound forecast.
- For the Australian dollar (Aussie), check out the AUD to USD forecast.
- For USD/CAD (loonie), check out the Canadian dollar forecast.
