USD/JPY was unchanged over the week, closing at 102.16. This week’s highlight is the Bank of Japan Monetary Policy Statement. Here is an outlook on the major market-movers and an updated technical analysis for USD/JPY.
Japanese manufacturing data disappointed last week. In the US, Unemployment Claims jumped, but retail sales numbers improved in November.
[do action=”autoupdate” tag=”USDJPYUpdate”/]USD/JPY daily chart with support and resistance lines on it. Click to enlarge: 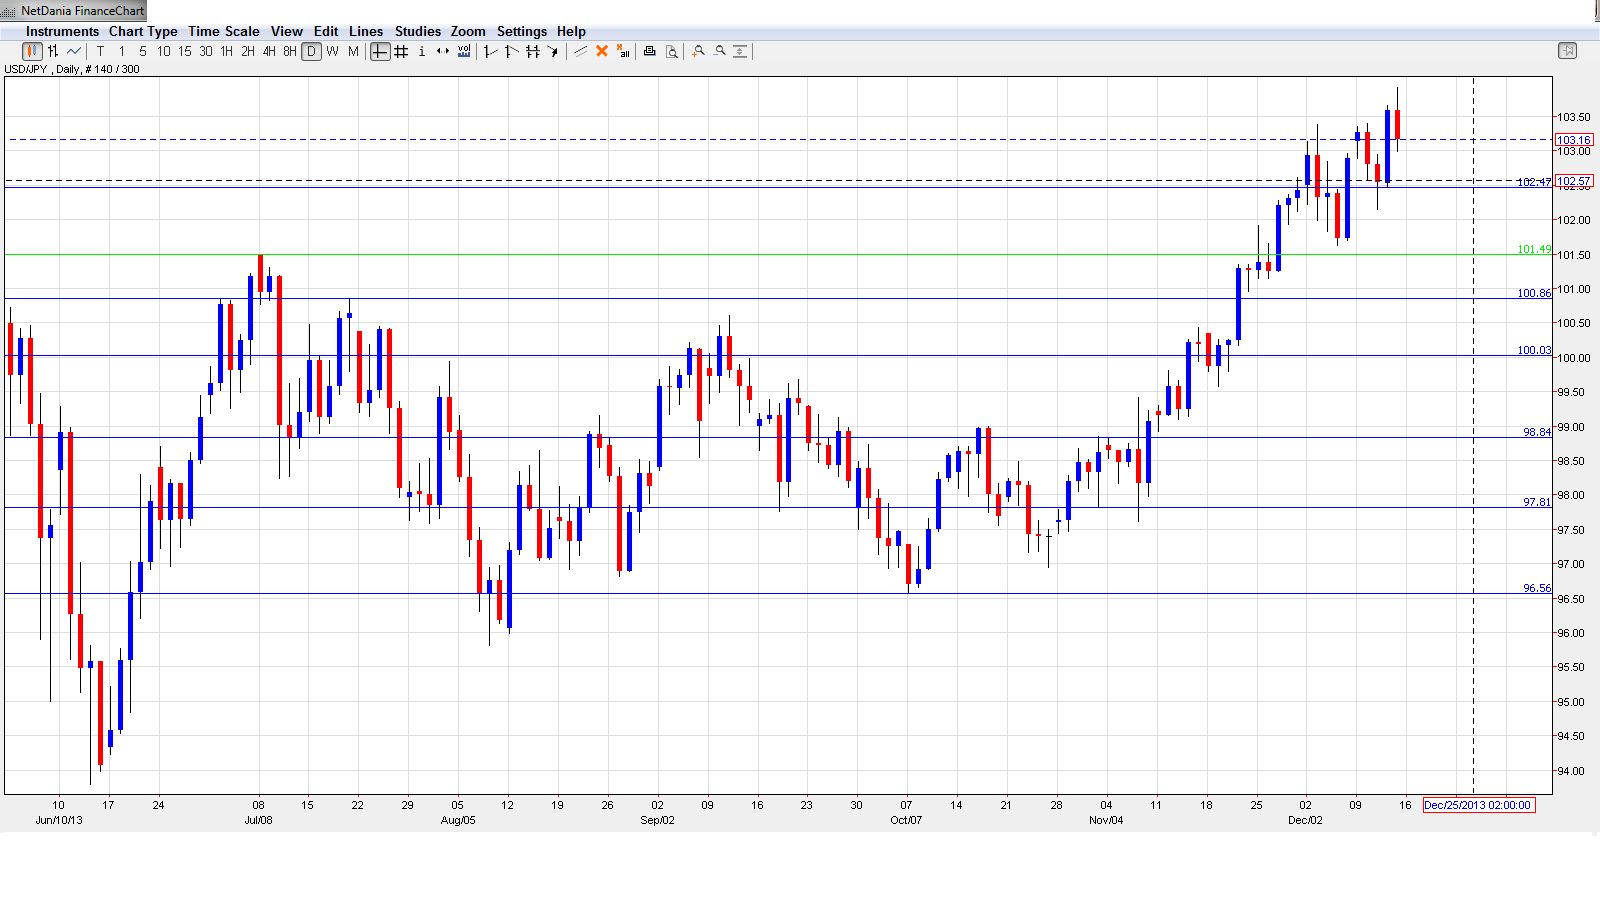
- Tankan Manufacturing Index: Sunday, 23:50. The Tankan Manufacturing Index is released each quarter, and is an important gauge of the health of the manufacturing sector. The G2 release jumped to 12 points, its best showing in almost six years. The markets are expecting the upward trend to continue, with an estimate of 15 points.
- Tankan Non-Manufacturing Index: Sunday, 23:50. This index has move steadily moving higher, and hit 14 points in Q2. The upward trend is expected to continue, with the estimate for Q3 standing at 16 points.
- Trade Balance: Tuesday, 23:50. Japan continues to post monthly trade deficits. The October deficit came in at -1.07 trillion yen ,much higher than the estimate of -0.88 trillion. The November forecast stands at -1.13 trillion yen.
- All Industries Activity: Thursday, 4:30. The indicator has posted some modest gains, with a reading of 0.4% last month. However, the markets are anticipating a downturn in November, with an estimate of -0.2%.
- Monetary Policy Statement: Friday, Tentative. This is the major event of the week. The BOJ is considered to stay the course as far as monetary policy, but we have seen some dissenting voices in recent statements, and this could again be the case in the upcoming release. The statement will be accompanied by a press conference.
*All times are GMT.
USD/JPY Technical Analysis
We begin with resistance at 106.66, which has held firm since November 2008. At that time, USD/JPY was in a downward spiral which saw it drop below the 0.90 line. This is followed by resistance at 105.70.
This is followed by resistance at the round number of 104. This was a key line back in May 2008. At the time, USD/JPY was in the midst of a rally which saw the pair climb as high as 110.
102.50 continues to be busy in December and was briefly breached last week. It begins the week in a support role.
101.44 was the post-crisis high seen in April 2009, and continues to provide strong support.
100.85 saw activity in July as the dollar showed strength against the yen. It has some breathing room as the pair trades at higher levels.
100, a key level, has strengthened in support as USD/JPY trades at higher levels. 98.80 is the next support level.
97.80 continues to provide strong support. The final support line for now is 96.59, which has held firm since the first week in October. It marks the low point of a downward trend by the pair which started in late September.
I am bullish on USD/JPY
The dollar continues to trade at high levels and the speculation around a possible QE taper by the Fed next week is likely to boost the US dollar.
- For a broad view of all the week’s major events worldwide, read the USD outlook.
- For EUR/USD, check out the Euro to Dollar forecast.
- For GBP/USD (cable), look into the British Pound forecast.
- For the Australian dollar (Aussie), check out the AUD to USD forecast.
- For USD/CAD (loonie), check out the Canadian dollar forecast.
