USD/JPY was the big star of the week, finally breaking the 100 line and with a big blast. Is the road open to 105, or will we see some consolidation?Tertiary Industry Activity, GDP and Core Machinery Orders are the main events this week. Here’s an outlook for the Japanese events and an updated technical analysis for USD/JPY.
The initial trigger for the storm was a better than expected jobless claims report in the US. This gave a boost to the greenback, and once the 100 line was broken, the pair shot higher. Japan’s current account balance increased less than expected in March, reaching a seasonally adjusted 0.34T, from 0.00T in the preceding month. Analysts anticipated Japan’s Current Account to rise 0.48T. Likewise, Japan’s service sector sentiment plunged to 56.5 in April, dropping for the first time in six months, following a 57.3 reading in March. These weak figures suggest Japan’s economy still has a long way to recovery.
Updates: USD/JPY stayed steady after the weekend, in which the G-7 did make some noise about Japan’s policies, but didn’t make any harsh statements. The pair is flirting around 102. The better than expected retail sales number helps the US dollar. M2 Money Stock rose 3.3%, beating the estimate of 3.1%. US Core Retail Sales declined 0.1%, matching the forecast. Retail Sales edged up 0.1%, beating the estimate of a 0.3% decline. Japanese inflation numbers showed improvement, as CGPI rose to 0.0%, bettering the forecast of -0.2%. It was the first time the indicator did not point to deflation since April 2012. The 30-year Bond Auction posted a yield of 1.78%. This was higher than the previous yield of 1.49%. Preliminary Machine Tool Orders continues to look weak, as the indicator recorded a decline of 24.1%. USD/JPY has edged lower, as the pair trades at 101.62. Wednesday :A fresh report that the BOJ will inject 2.8 trillion yen to the bond market to curb higher yields sent USD/JPY above 102.40 to a peak of 102.60. Where will it stop? Tertiary Industry Activity declined 1.3%, a much sharper loss than the -0.6% forecast. Consumer Confidence came in at 445. points, missing the estimate of 45.8 points. Preliminary GDP hit a four-month high, climbing 0.9%. This beat the estimate of 0.7%. Preliminary GDP Price Index continues to point to deflation, as it dropped 1.2%. This missed the estimate of -1.0%. Revised Industrial Production rose 0.9%, easily surpassing the estimate of 0.2%. Core Machinery Orders will be released later on Thursday. USD/JPY has edged lower, as the pair was trading at 102.30. The Japanese government presented new stimulus, Abenomics 2.0, but this didn’t weaken the yen too much, and it maintains the 101.80 to 102.70 range. In general, the US dollar is expected to strengthen.
USD/JPY daily chart with support and resistance lines on it. Click to enlarge: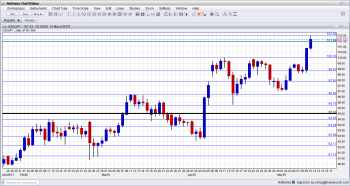
- M2 Money Stock: Monday, 0:50. M2 money stock in March rose 3.0% on a yearly base, reaching ¥833.6 trillion, higher than the 2.9% rise predicted by analysts and following a 2.9% growth in the previous month. Meanwhile, M3 money stock gained 2.5% to ¥1,141.3 trillion in March, following the 2.4% growth in the previous month. A rise of 3.1% is expected now.
- Tertiary Industry Activity: Wednesday, 0:50. Japan’s service sector activity index edged up by 1.1% in February, following a contraction of the same amount in the previous month. Analysts expected Japanese tertiary industry activity index to rise 0.8% last month. A decline of 0.6% is forecasted.
- Consumer Confidence: Wednesday, 6:00. Japanese consumer confidence improved in March to the highest level in almost six years, reaching 44.8 from 44.2 in February, indicating the sharp change of monetary policy is starting to show its worth. The survey showed 71.8% of respondents expected prices to rise within the next 12 months. A further rise to 45.8 is expected.
- GDP: Thursday, 0:50. This is the first GDP report for Q1, and actually the first report for the new government led by Shinzo Abe. Is Abenomics working? An expansion of 0.7% is anticipated.
- Revised Industrial Production: Thursday, 5:30. Japanese industrial production continued to improve in February, rising by 0.6% following a 0.3% gain in the previous month. However, industrial production fell 10.5% from February 2012. The Japanese economy saw unchanged GDP in the fourth quarter, following two quarters of economic decline. An increase of 0.2% is forecasted.
- Core Machinery Orders: Friday, 0:50. Japan’s core machinery orders soared 7.5% in February, rebounding from a sharp drop of 13.1% in the previous month. The month-on-month increase in core orders excluding equipment for ships and power utilities – compared was a bit higher than the6.9% rise predicted by analysts. A rise of 3.5% is expected now.
*All times are GMT.
USD/JPY Technical Analysis
Dollar/ ¥ started the week trading above the 98.80 line (mentioned last week). After the usual range trading under 100, the pair made a huge move upwards, breaking the 100 line and quickly reaching for 101. It then hesitated above 101.44, but eventually broke this line as well.
[do action=”tradingviews” pair=”USDJPY” interval=”60″/]- Technical lines from top to bottom
We start from much higher ground: 105.50 is above the round number of 105 and worked as resistance during 2008. It worked as support later in the year. Below, 104.60 slowed the pair’s rise in early 2008.
103.50 is a strong line that worked as support for the pair in July and September 2008 and is a key to any strong upside move. 102.60 is also a strong line after working as support for a long period of time during mid-2008.
102 is a round number and capped the pair in May 2013. It is minor at the moment. The 101.44 line, which was the post crisis high seen in April 2009. is now support.
The obvious number below is the very round number of 100 and would be closely watched on any drop. 98.90 capped the pair in June 2009 and serves as minor resistance.
A stronger line is the 97.80 line, which was a peak back in 2009 and was reached in April 2013. The pair stumbled below this line, which is getting weaker. The round 97 line worked as important support in May 2013.
The March 2013 peak of 96.71 is the next line, which now switches to support. 95.88 provided a temporary stop on the way up and was also the swing low on a fall during April. The round number of 95 is also watched by many and will remain critical support on a reversal.
Another recent technical view: James Chen marks the next levels for USD/JPY.
I remain bullish on USD/JPY
The pair made a big move, but already managed to consolidate some of the gains. So, we could see another move higher, probably not in the same scale as seen beforehand. A stronger dollar is supported by lots of optimism in the US: not only from the jobless claims report, but also from a report about better-than-expected tax revenue. This defers the debt-ceiling issues and also shows that the US economy is doing well.
In Japan, the GDP report will probably show that “Abenmoics is working” and this could encourage the BOJ to provide more monetary stimulus, to gain a win also on deflation.
More: Fasten your seat belts – more turbulence ahead
Further reading:
- For a broad view of all the week’s major events worldwide, read the USD outlook.
- For EUR/USD, check out the Euro to Dollar forecast.
- For GBP/USD (cable), look into the British Pound forecast.
- For the Australian dollar (Aussie), check out the AUD to USD forecast.
- For USD/CAD (loonie), check out the Canadian dollar forecast