USD/JPY gained about 100 points last week, as the pair closed the week above the key 100 level. This week’s highlight is the BOJ Monetary Policy Statement. Here is an outlook on the major market-movers and an updated technical analysis for USD/JPY.
Japanese GDP dropped to 0.5% in Q3, as economic activity continues to contract in 2013. US numbers were mildly disappointing, with employment and trade balance numbers falling short.
[do action=”autoupdate” tag=”USDJPYUpdate”/]USD/JPY daily chart with support and resistance lines on it. Click to enlarge: 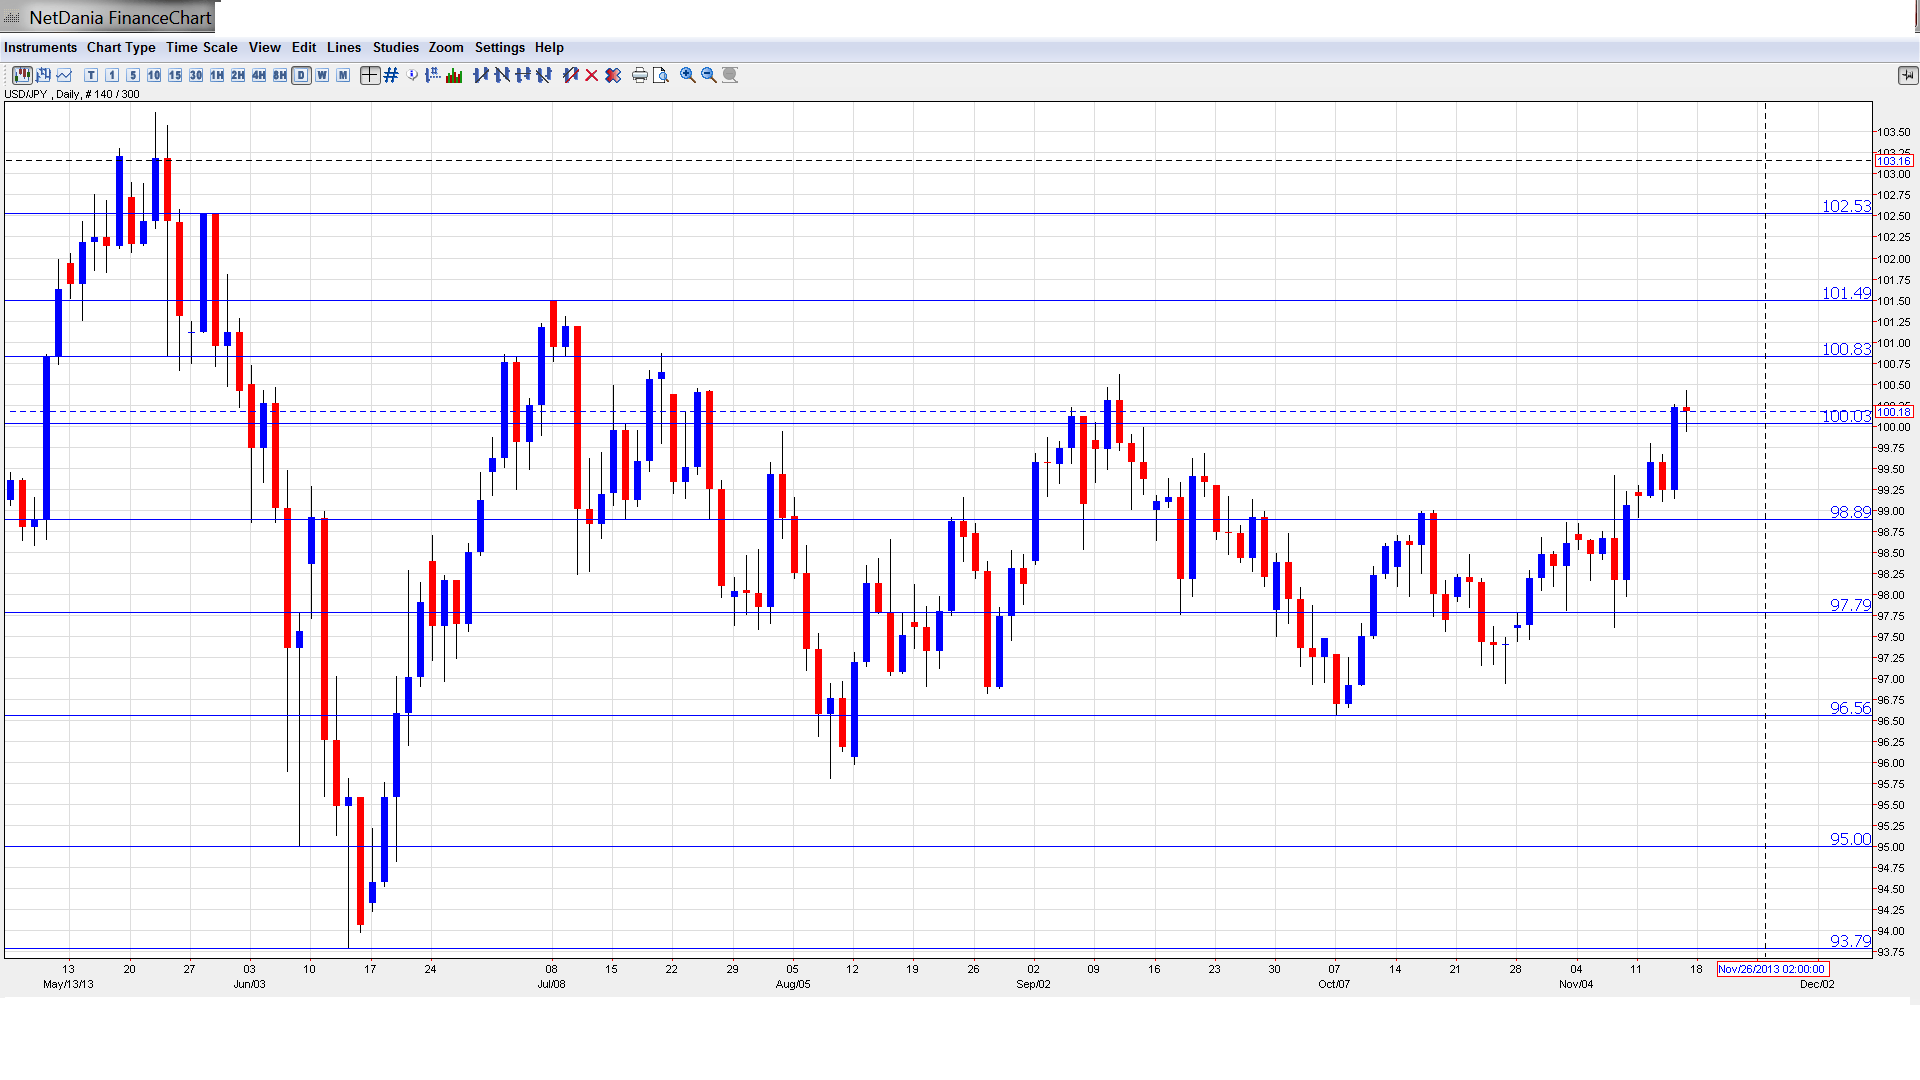
- Trade Balance: Tuesday, 23:50. Japan continues to post monthly deficits. The September deficit ballooned to JPY 1.09 trillion, above the estimate of 1.06 trillion. The markets are expecting a smaller deficit of 0.88 trillion in the upcoming release.
- All Industries Activity: Wednesday, 4:30. This indicator measures the change in the total amount of goods and services purchased by businesses. Last month, the indicator posted a gain of 0.3%, matching the estimate. The markets are expecting an improvement in October, with an estimate of 0.5%.
- Monetary Policy Statement: Thursday, Tentative. This is the major event of the week. The BOJ will release its monetary policy statement. Analysts will be looking for hints of any changes to the Bank’s current monetary program, which has led to the yen trading close to the 100 level.
- BOJ Monthly Report: Friday, 5:00. This event provides an analysis of current and future economic conditions from the BOJ’s persective. It is a minor release and is unlikely to affect the movement of USD/JPY.
*All times are GMT.
USD/JPY Technical Analysis
We begin with resistance at 105.70. This line was last test in October 2008.
This is followed by resistance at the round number of 104. This was a key line back in May 2008. At that time, USD/JPY was in the midst of a rally which saw the pair climb as high as 110.
102.50 was an important resistance line in late May but has not been tested since that time.
101.44 was the post-crisis high seen in April 2009, and has not been tested since mid-July. 100.85 saw activity in July as the dollar showed strength against the yen. If the US dollar continues to gain ground, this line could face some pressure.
100, a key level, was breached last week for the first time since September. It starts the week as weak resistance and could see acitivity early in thee week.
98.90 held firm as USD/JPY posted modest losses early last week. It has some breathing room as the pair trades above the 100 level.
97.80 continues to provide strong support. 96.59 has held firm since the first week in October. It marks the low point of a downward trend by the pair which started in late September.
The round number of 95 is a psychologically significant line. It has held firm since mid-June.
93.79 is our final support line. It marked the low point of a rally by USD/JPY which started in mid-June and saw the pair climb to the mid-101 range in July.
I am bullish on USD/JPY
The dollar is enjoying a solid run against the yen, closing the week with gains for the third straight week. Will the upward trend continue? The dollar shrugged off Janet Yellen’s support for continued QE, and the possibility of a December taper could well help the US dollar gain ground against the majors this week.
- For a broad view of all the week’s major events worldwide, read the USD outlook.
- For EUR/USD, check out the Euro to Dollar forecast.
- For GBP/USD (cable), look into the British Pound forecast.
- For the Australian dollar (Aussie), check out the AUD to USD forecast.
- For USD/CAD (loonie), check out the Canadian dollar forecast.
